Getting started
Documentation Menu
What Nodes is
Nodes is a JavaScript-based 2D canvas for computational thinking. It’s powered by web technologies and the npm ecosystem. We take inspiration from popular node-based tools but strive to bring the visual interface and textual code closer together while also encouraging patterns that aid the programmer in the prototype and exploratory stage of their process.
Nodes was created and developed by Nick Nikolov, Marcin Ignac and Damien Seguin since 2017 inside Variable. Even as the very nature of the tool is to experiment and explore new ways to play with code and data, Nodes has been used in several production-grade projects and tested in various real-world scenarios. We have used it to create realtime 3D graphics installations, explore and visualise data, experiment with AI and export results in various formats like images for print, videos for social media, 3D models for mobile AR and data files for further processing.
Read the full story of Nodes and what inspired us to make it by visiting our story page.
What Nodes isn’t
A game engine: Nodes is designed to be a flexible tool with no single-minded purpose. It doesn’t come with any built-in graphics engine or game specific tooling, only a flexible sketchpad to build upon it.
A visual programming environment with batteries included: Unlike other visual programming environments, Nodes doesn’t include a large library of predefined nodes. It is instead designed for experimentation “from scratch”, with a focus on coding as much as on visual programming. It does however come with support for the npm ecosystem and give access to the power that its packages provide.
3D authoring tool: in Nodes, programming is done in JavaScript, not in Python like in many 3D procedural generation authoring tools. It doesn’t come with a set of geometry algorithms (you’ll need to use an npm package or write your own instead) and emphasise both writing code and visual programming. It also has the ability to run realtime applications with its WebGL canvas support.
UI overview
Below is the typical development environment of a Nodes project:
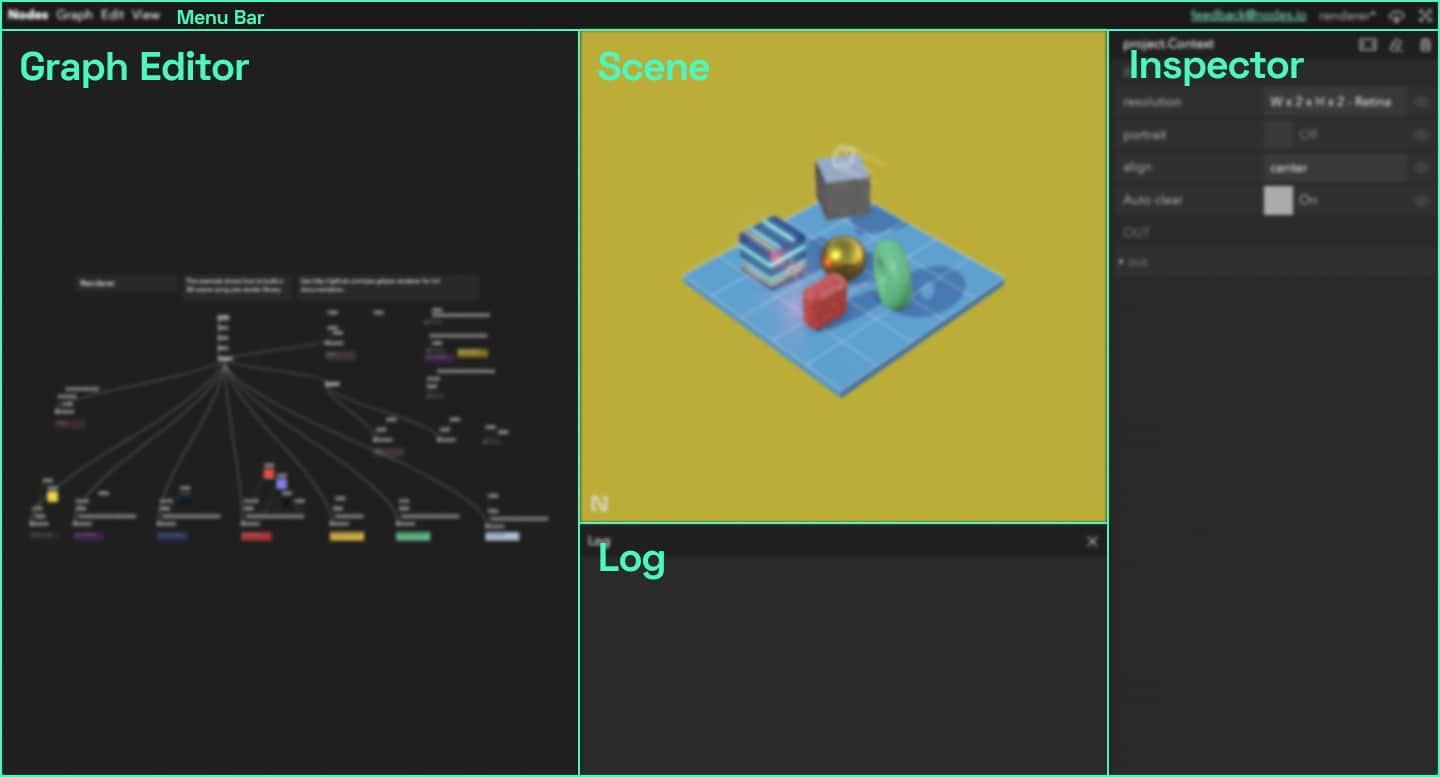
- Graph Editor: contains the visual representation of a graph, where all node manipulation happens
- Scene: a container usable for visualisation, whether with DOM, 2D Canvas, WebGL or any Web API
- Inspector: a panel where nodes parameters and connections are displayed and can be updated
- Log: a space to log data from nodes
- Menu Bar: an access for all the editing, viewing and formatting features
The building blocks of Nodes
A Nodes project is a repository of independent applications called graph.
A graph is the main structure that handles the data flow between individual components: the nodes.
These nodes are basically code modules thought as self contained piece of functionality. Nodes are defined by their code but also their ports.
Ports control both the connections between nodes and an individual node’s data. We divide them in two categories:
- Triggers: allow a top-down communication between nodes by triggering a callback chain and passing props to them (for example a
requestAnimationFrameloop passing a Canvas 2D context to every child node). - Parameters: hold data of any kind on a node. They can be passed down to other nodes ports, triggering on change events (for example a 3D position port changing every now and then, connected to a Camera node’s translation port).
Ports flow in both directions: in and out of a node.
Below you can find the basic anatomy of a node, this will hopefully give you an idea of how everything works before moving forward.
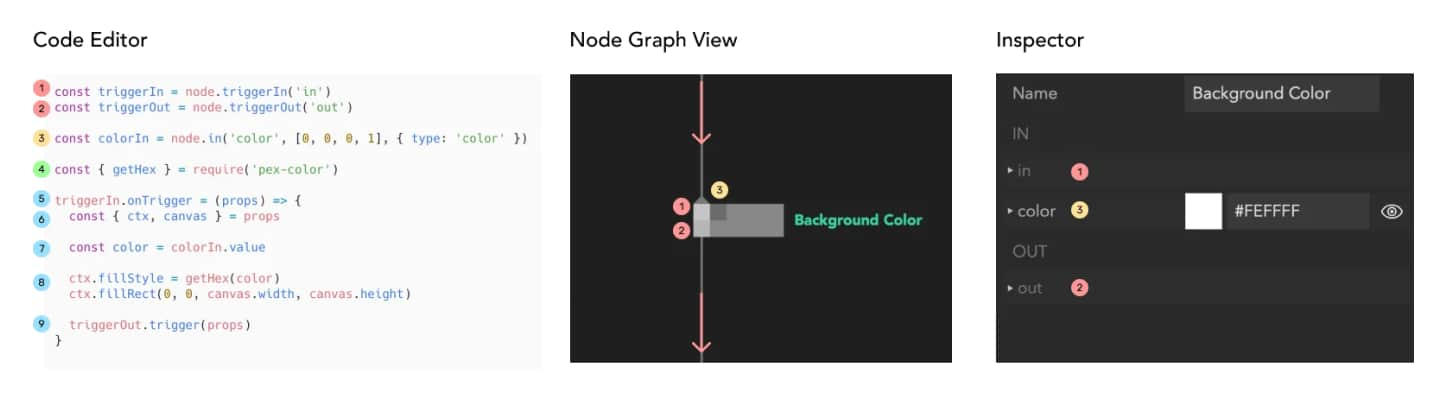
- Incoming trigger - connection from parent node
- Outgoing trigger - connection to child nodes
- Incoming parameter - with type
colorresulting in a colour picker widget in the inspector - Importing a package from npm (has to be added to the project first)
- Trigger callback - this is usually called every frame
- Reading properties provided by the parent node
- Reading input parameter value
- Main node code - drawing a rectangle with a given colour
- Passing data further down to the child nodes
Hello World
Let’s start by opening one of the example graphs provided with the Nodes application:
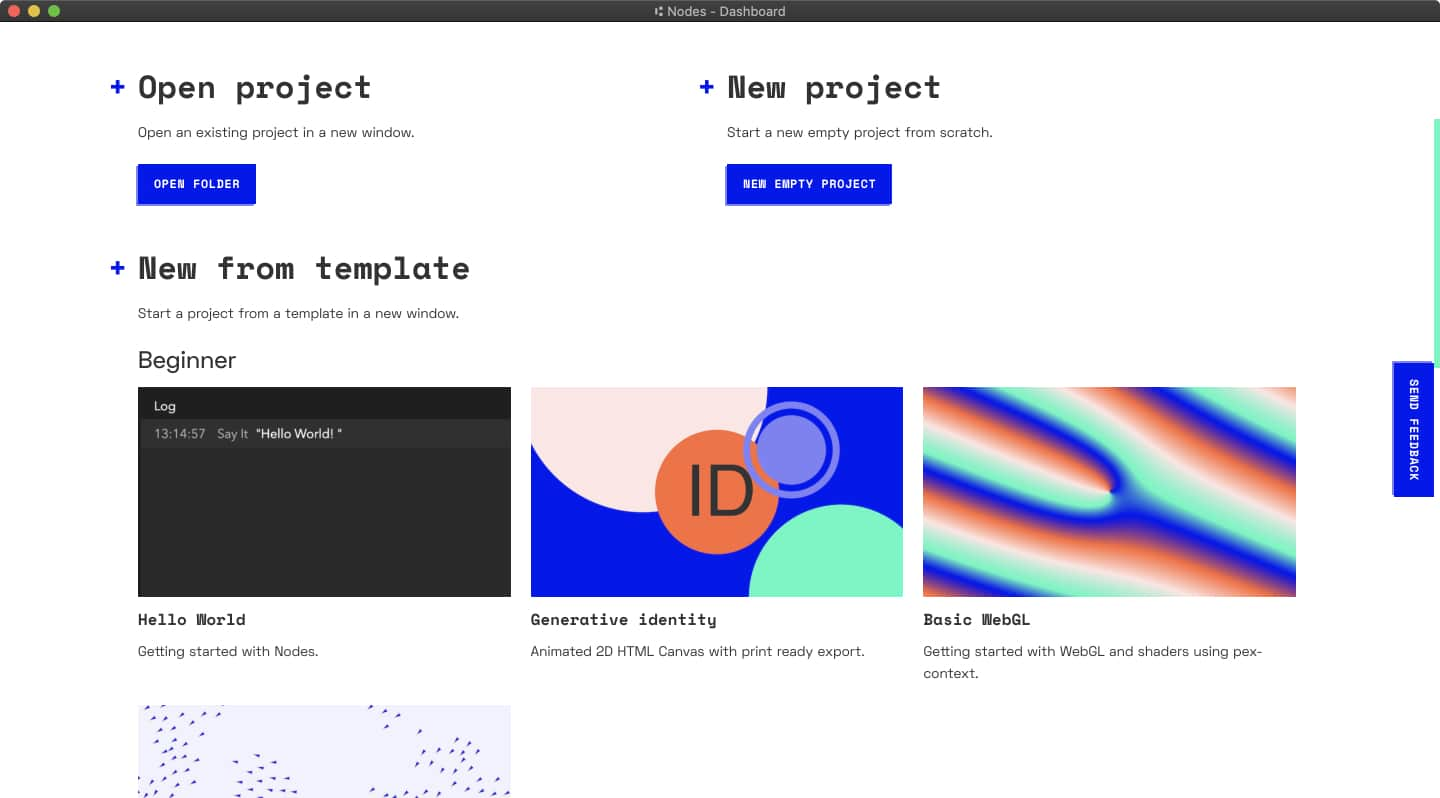
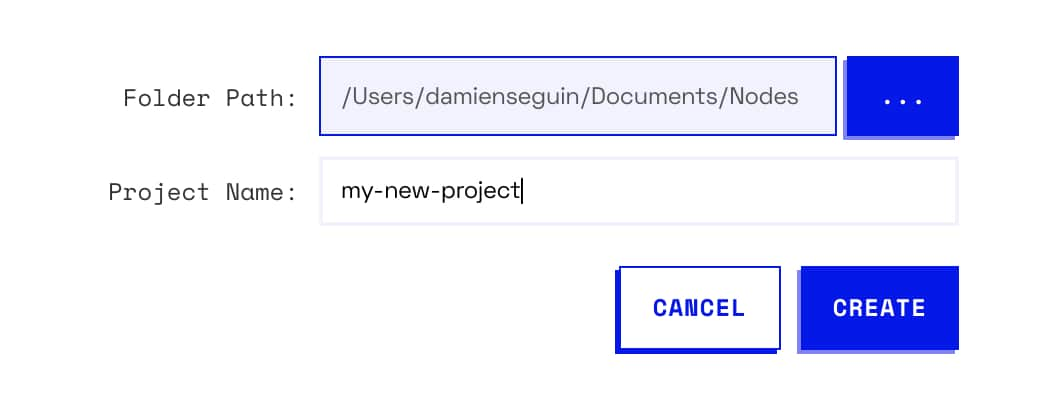
Click on the “Hello world” example. First, we need to find a location to save our project and give it a name.
Once any dependencies are installed and the project bundled, you should see this:
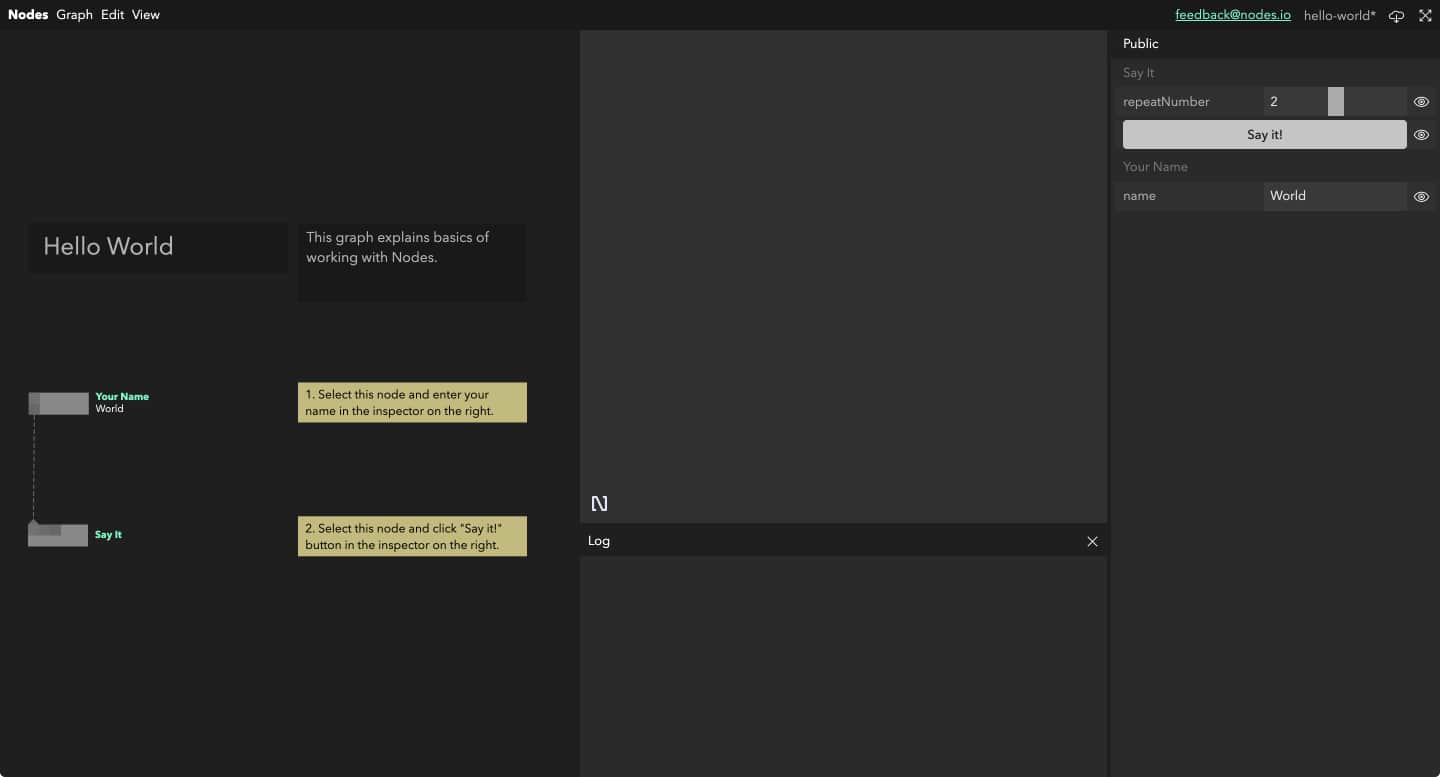
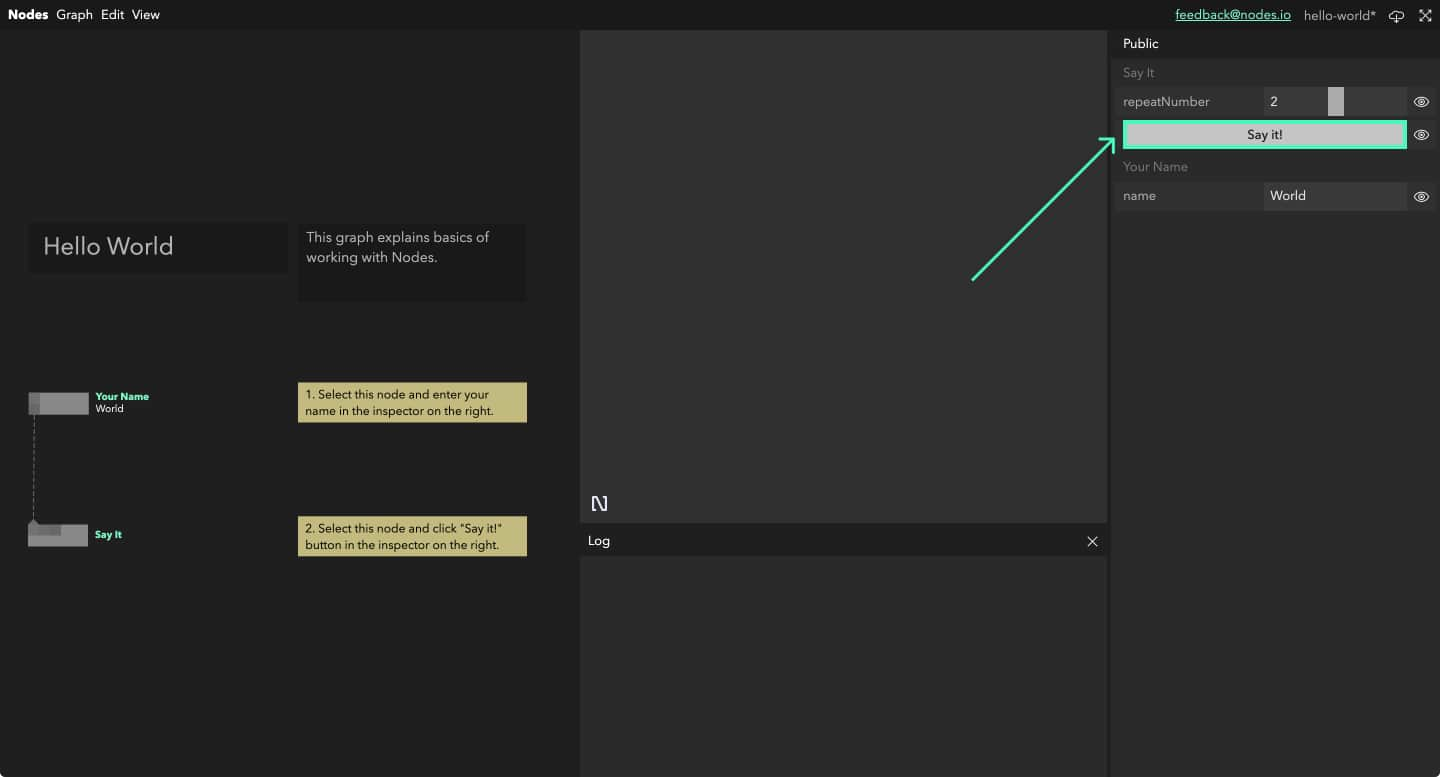
Try pressing the “Say it!” button to say hi. The alert message will also be displayed as a comment below the node “Say it”.
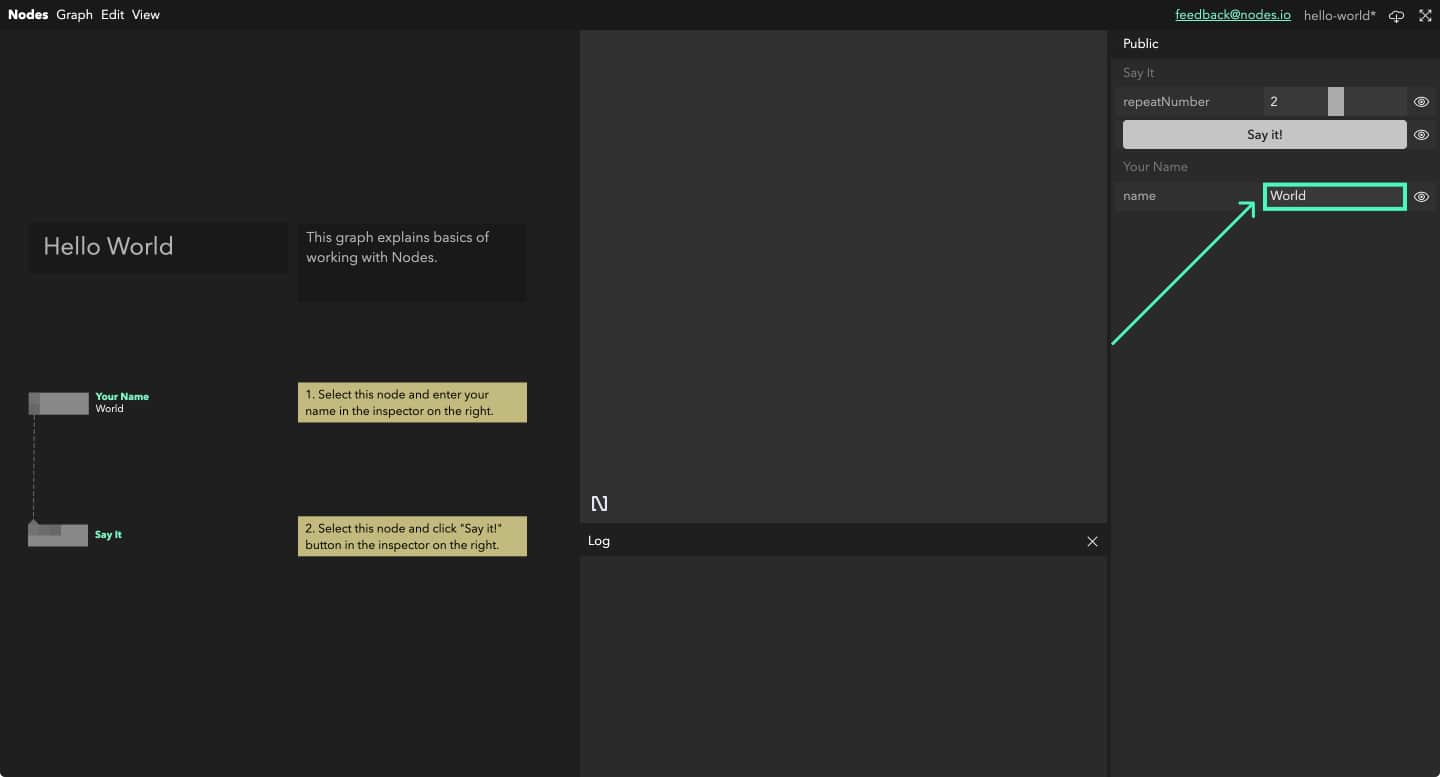
If you click on the node “Your name”, you will see a text box in the inspector. Try entering your name in it, deselecting the node and pressing the “Say it!” button again. You can also try altering the number of repeats in the “Say it” node.
You may have noticed that some parameters in the inspector have a white eye icon next to them. That means these parameters are “Published” and are available when going fullscreen or when no other node is selected.

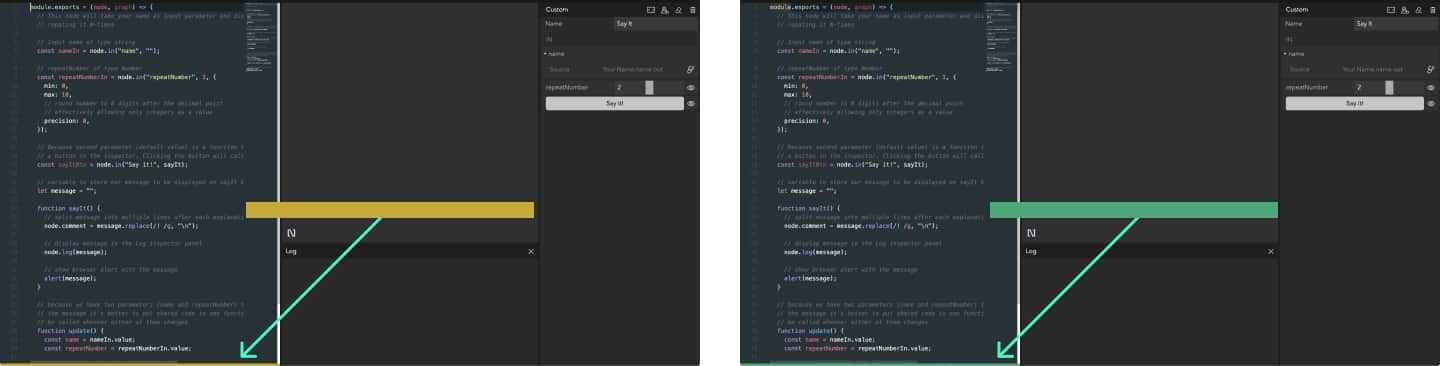
If you want to dive deep into a node and get an idea of how it works, double click on it to bring up the text editor. Try playing with the values, altering code, and experimenting. To compile and see your changes, press Shift+Enter, you’ll use this a lot!
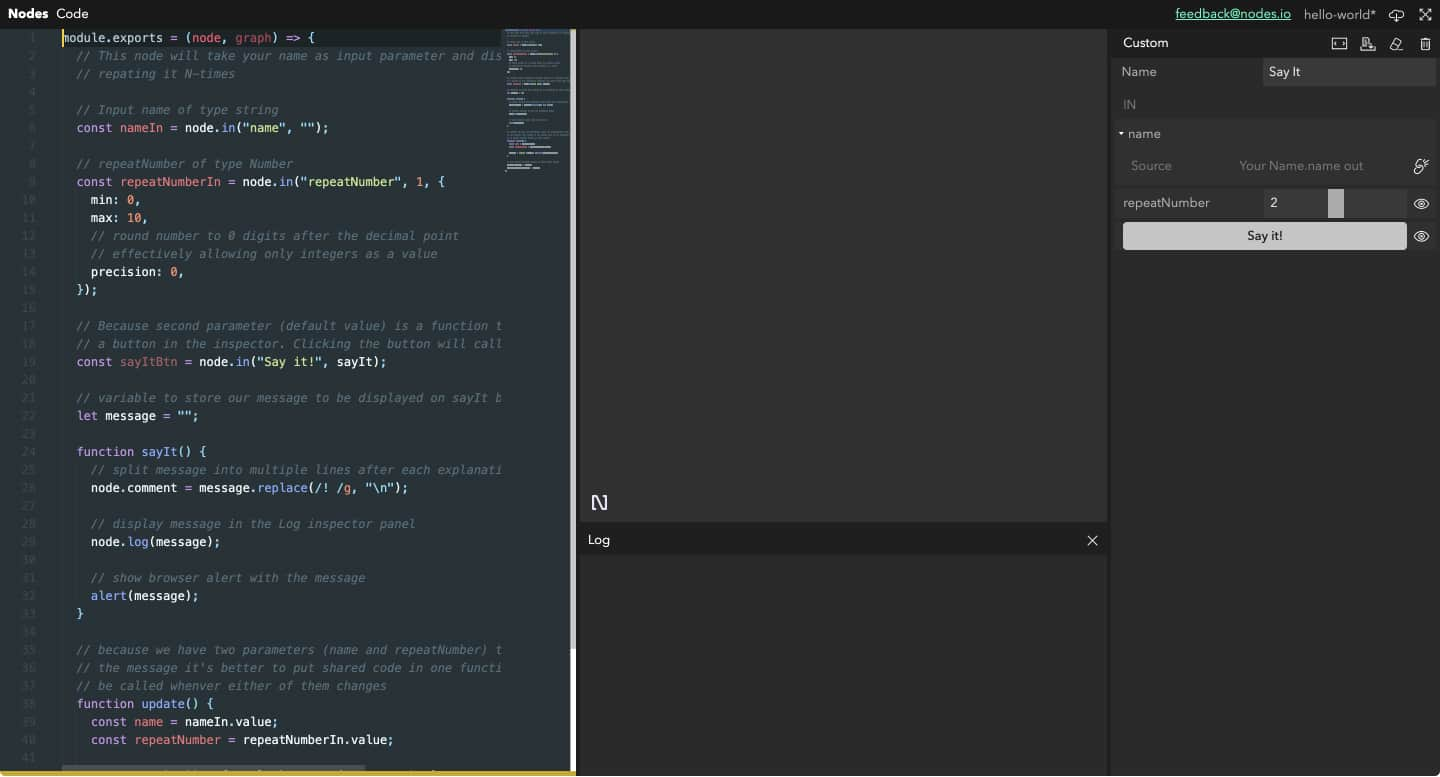
A status bar at the bottom of the editor will turn yellow when editing, meaning that they are uncompiled changes. Once compiled, the bar will turn green or red in case your code contains an error (the error message being displayed at the top of the Inspector).
Once you are done, you can close the code editor using Escape.
Next steps
Those are the absolute basics of working within Nodes. We now recommend you go through the tutorial and start building your very own graph. Find the links below: