Tutorial
Documentation Menu
Overview
In this tutorial, you will create your first graph: a generative poster maker. You can actually try it out below by moving your mouse around and see how the shapes are responding to movement:
The steps below are meant to give you a feel for creating a Nodes project from start to end. Don’t be afraid of simply copy-pasting the code: it’s more important to follow through than focus on implementation details for now.
If you are stuck at any point, you can download the complete project code for this tutorial here: my-first-project.zip.
We won’t get into much details about UI or how Nodes works: please skim through Getting Started first to understand the basics. You can also check out the Manual and API Reference for more detail.
Prerequisites: this tutorial assumes basic knowledge of HTML and JavaScript. If you are new to JavaScript, First Steps course on Mozilla Developer Network is a good place to start.
Setup
Let’s start by setting up your new project:
- Open the
Nodesapp if you are reading this tutorial in the browser. - Go to the Dashboard window. If it is closed, you can always reopen it by clicking menu File > Open Dashboard (
Cmd/Ctrl+T). - Click the
New Empty Projectbutton. - Choose a folder where you want it to be saved and give the project a name e.g.
my-first-project. - Click the
Createbutton.
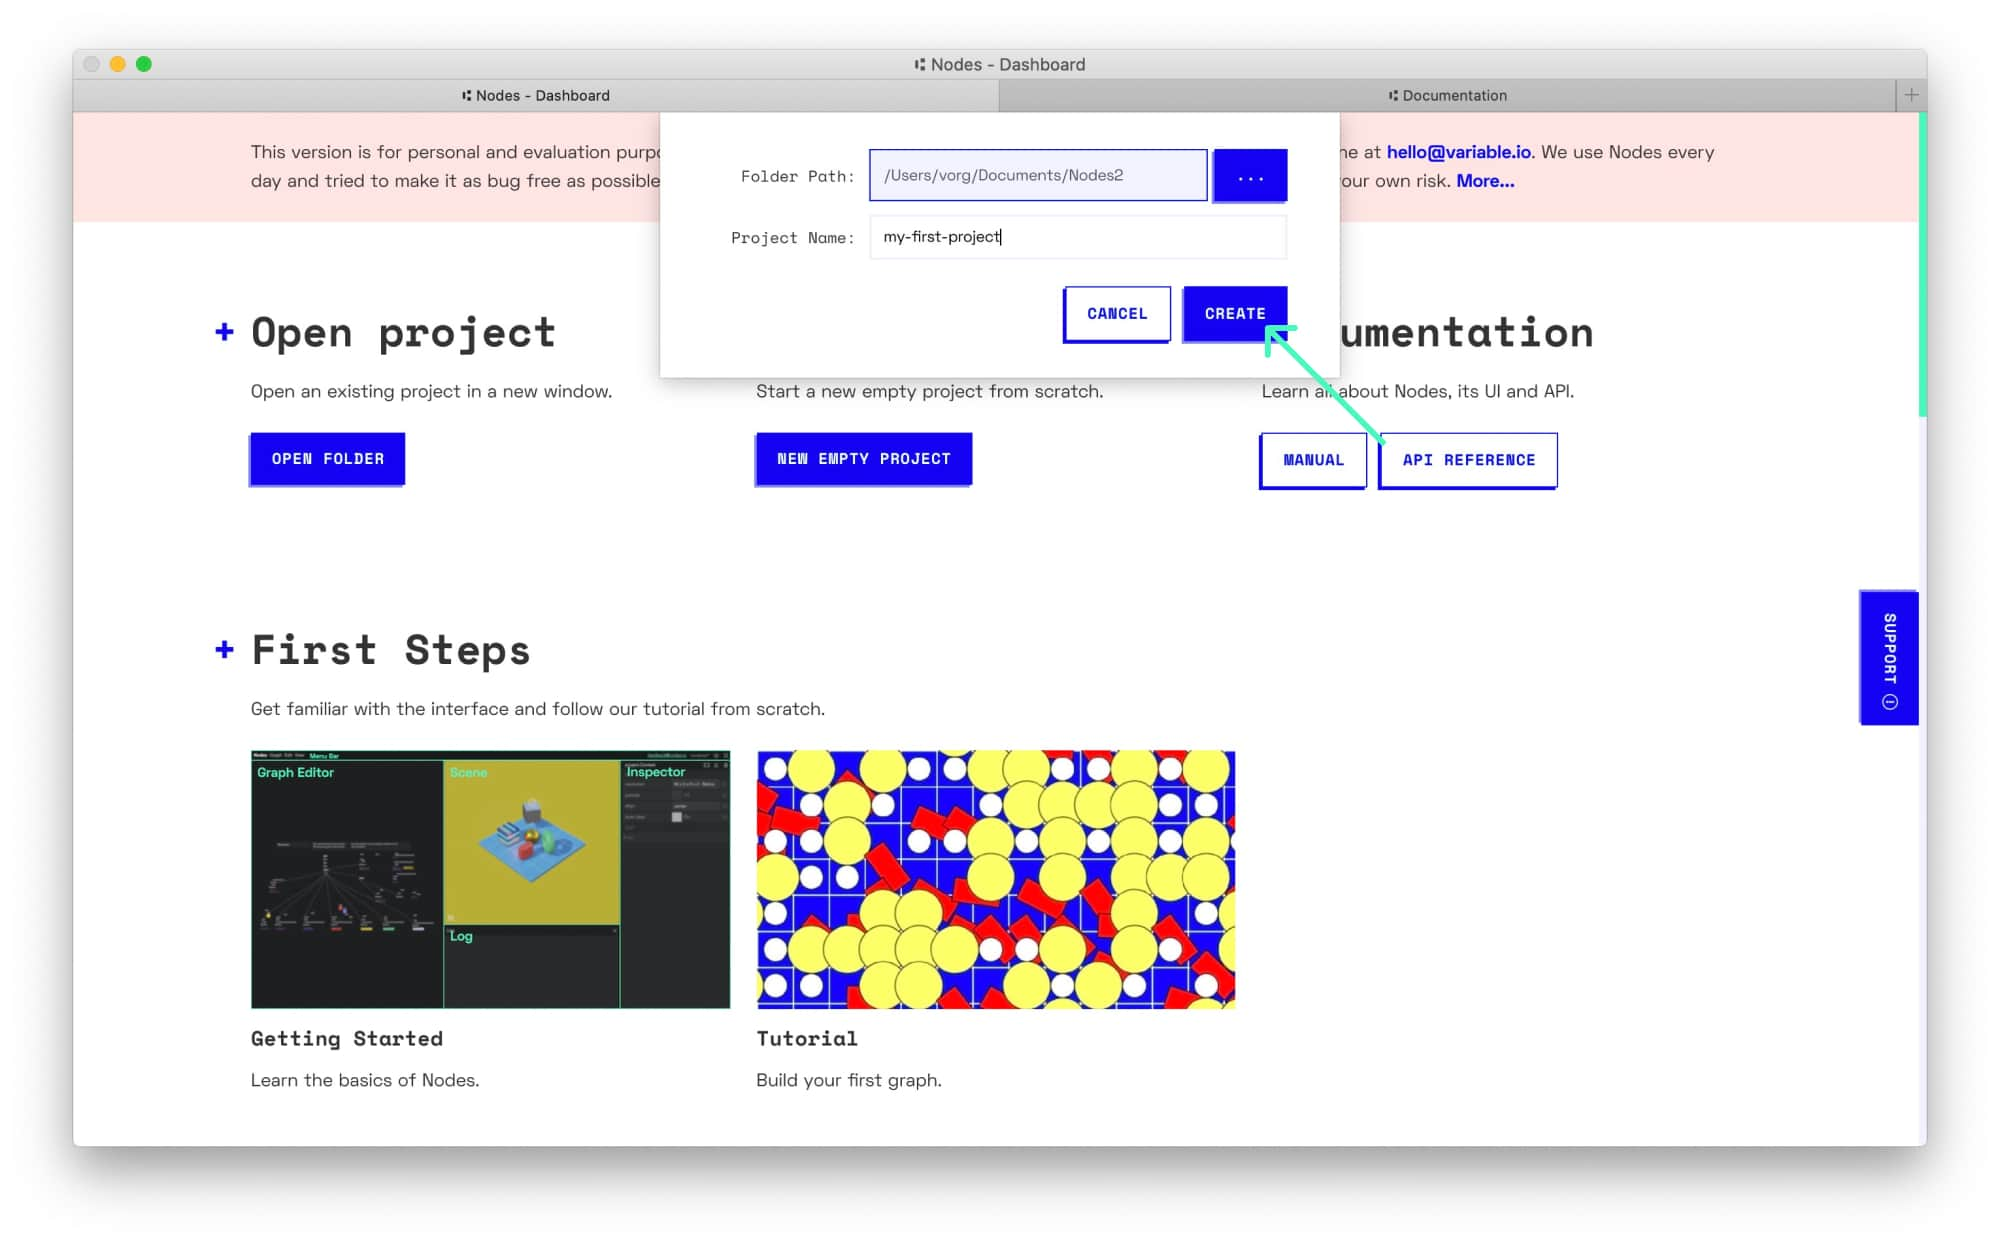
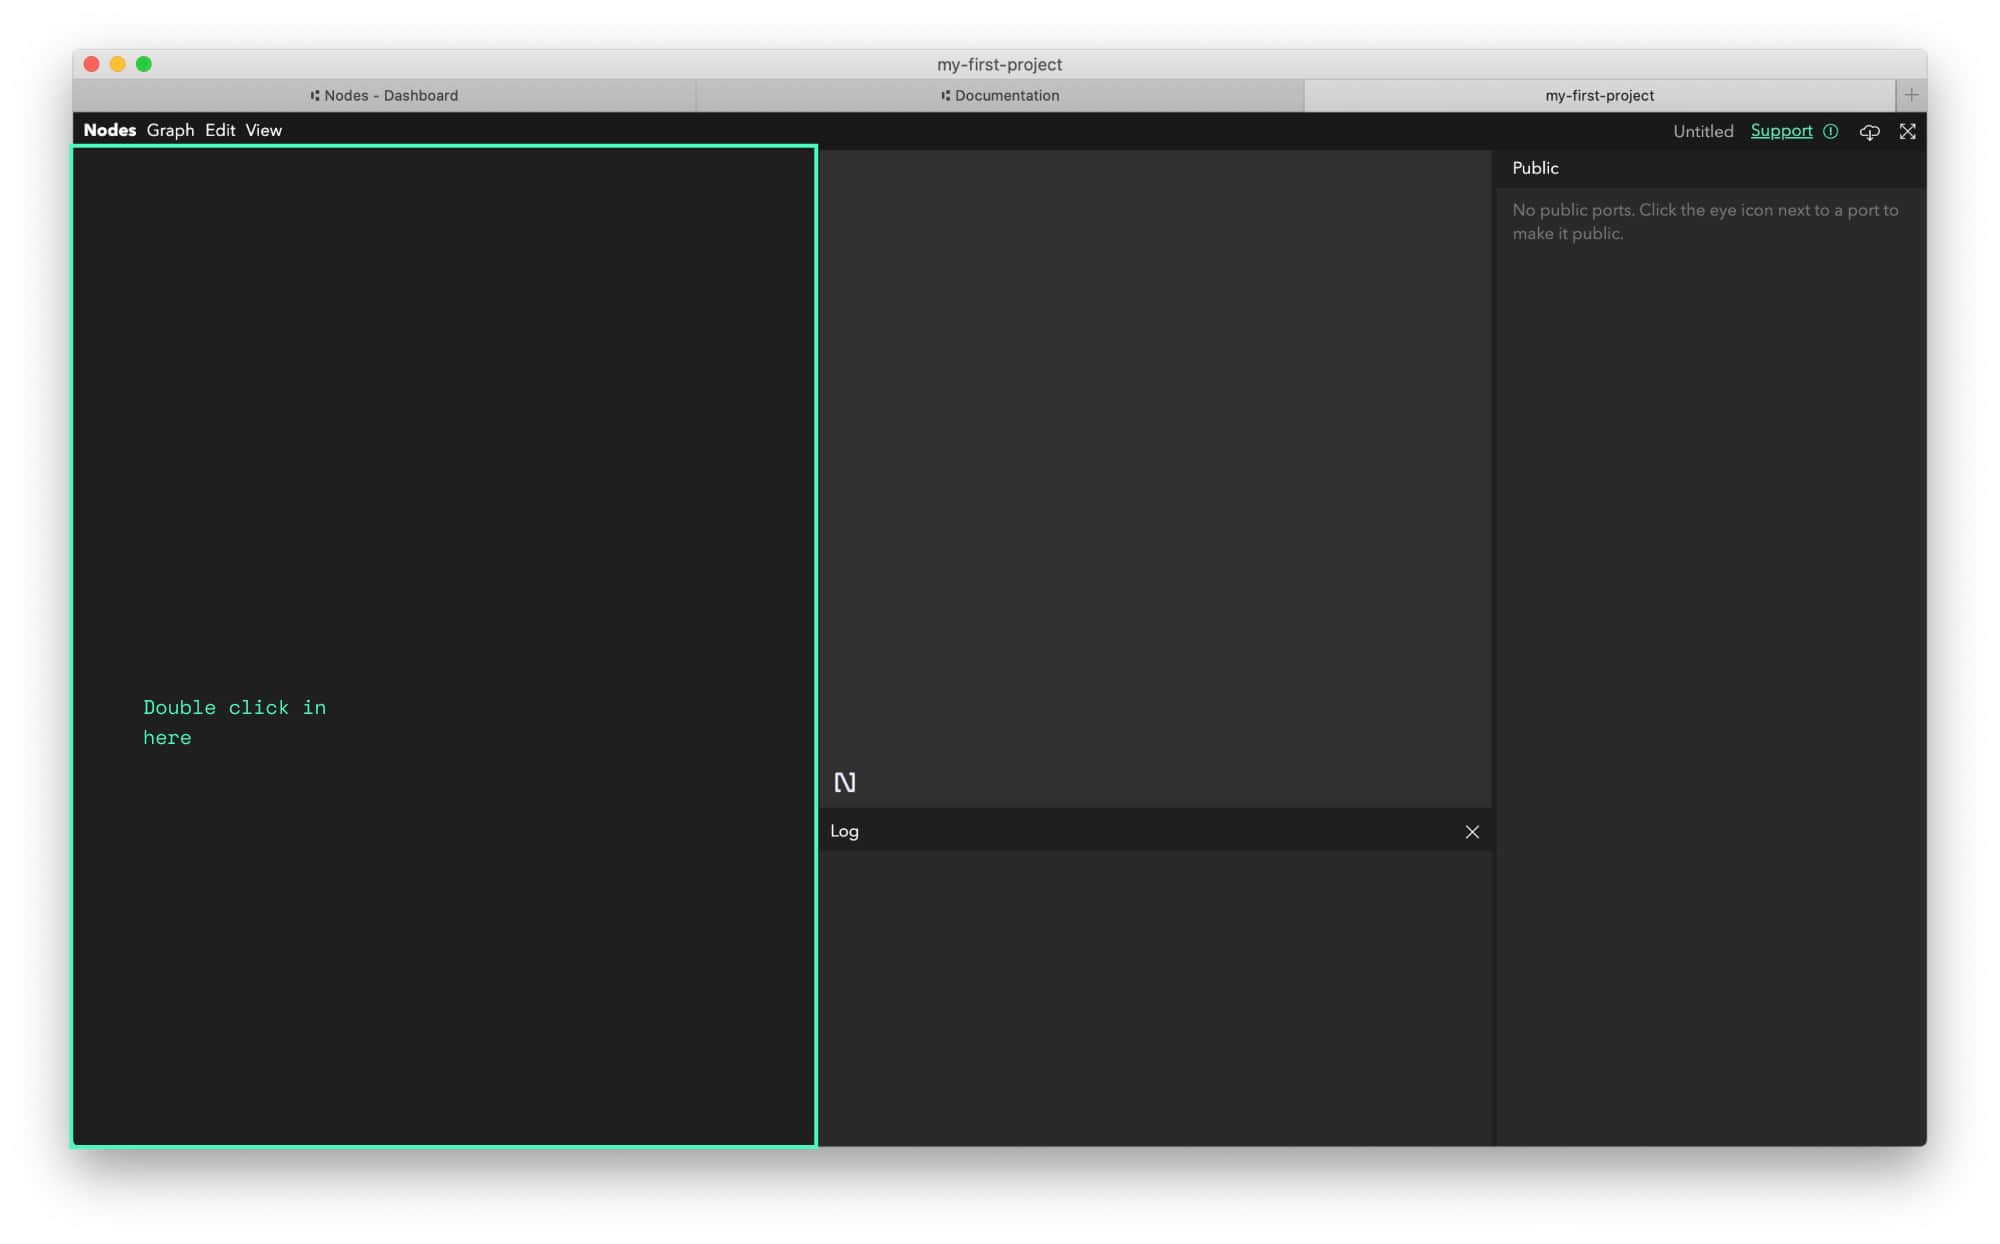
A new project window should open and you should see an empty canvas:
Create a graphic canvas
Let’s add our first node to the graph. Nodes are pieces of code that you combine together to create an application. A Graph is the visual representation of these nodes and the connections between them.
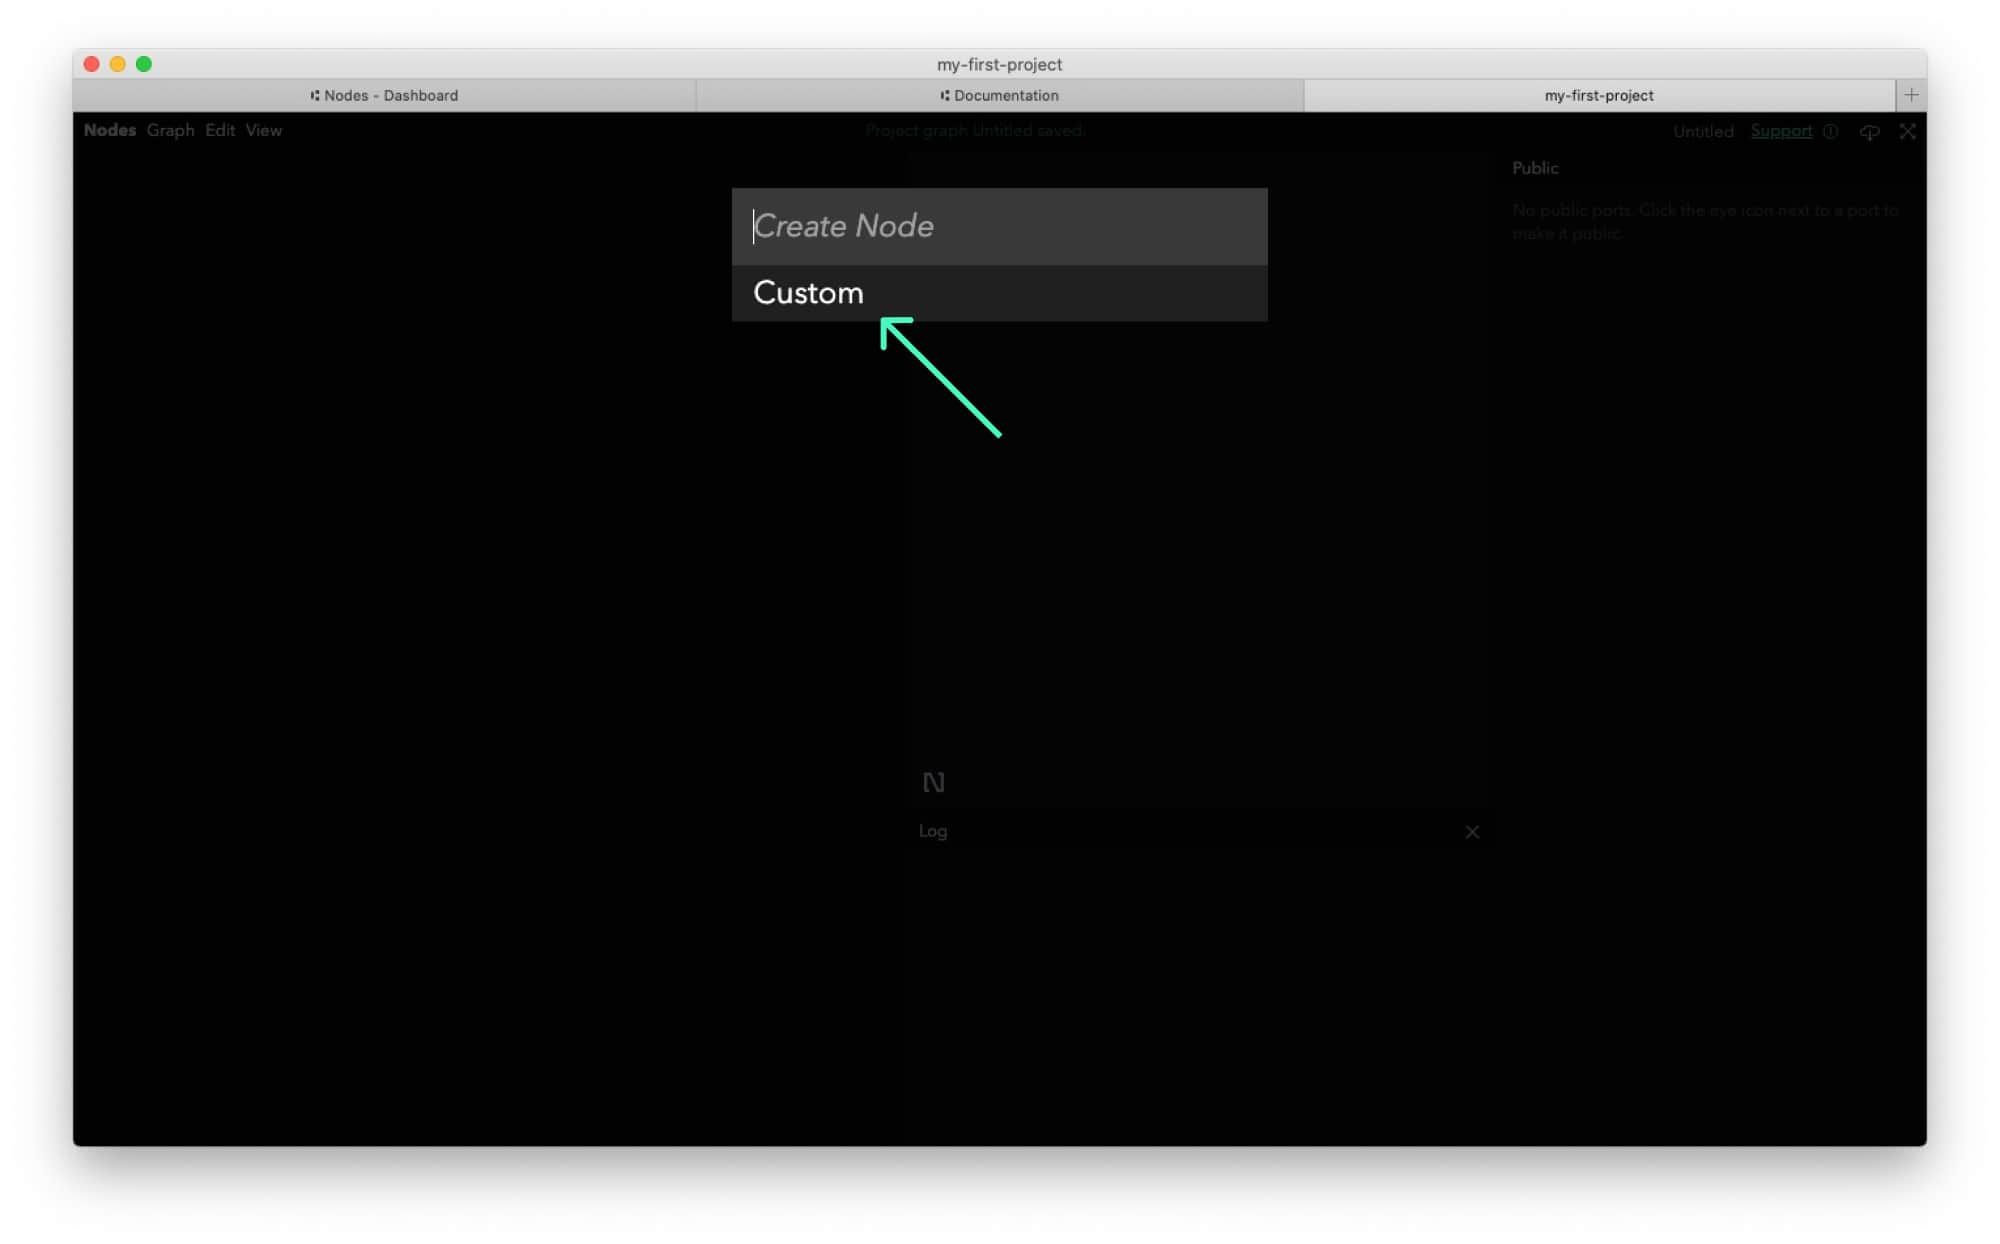
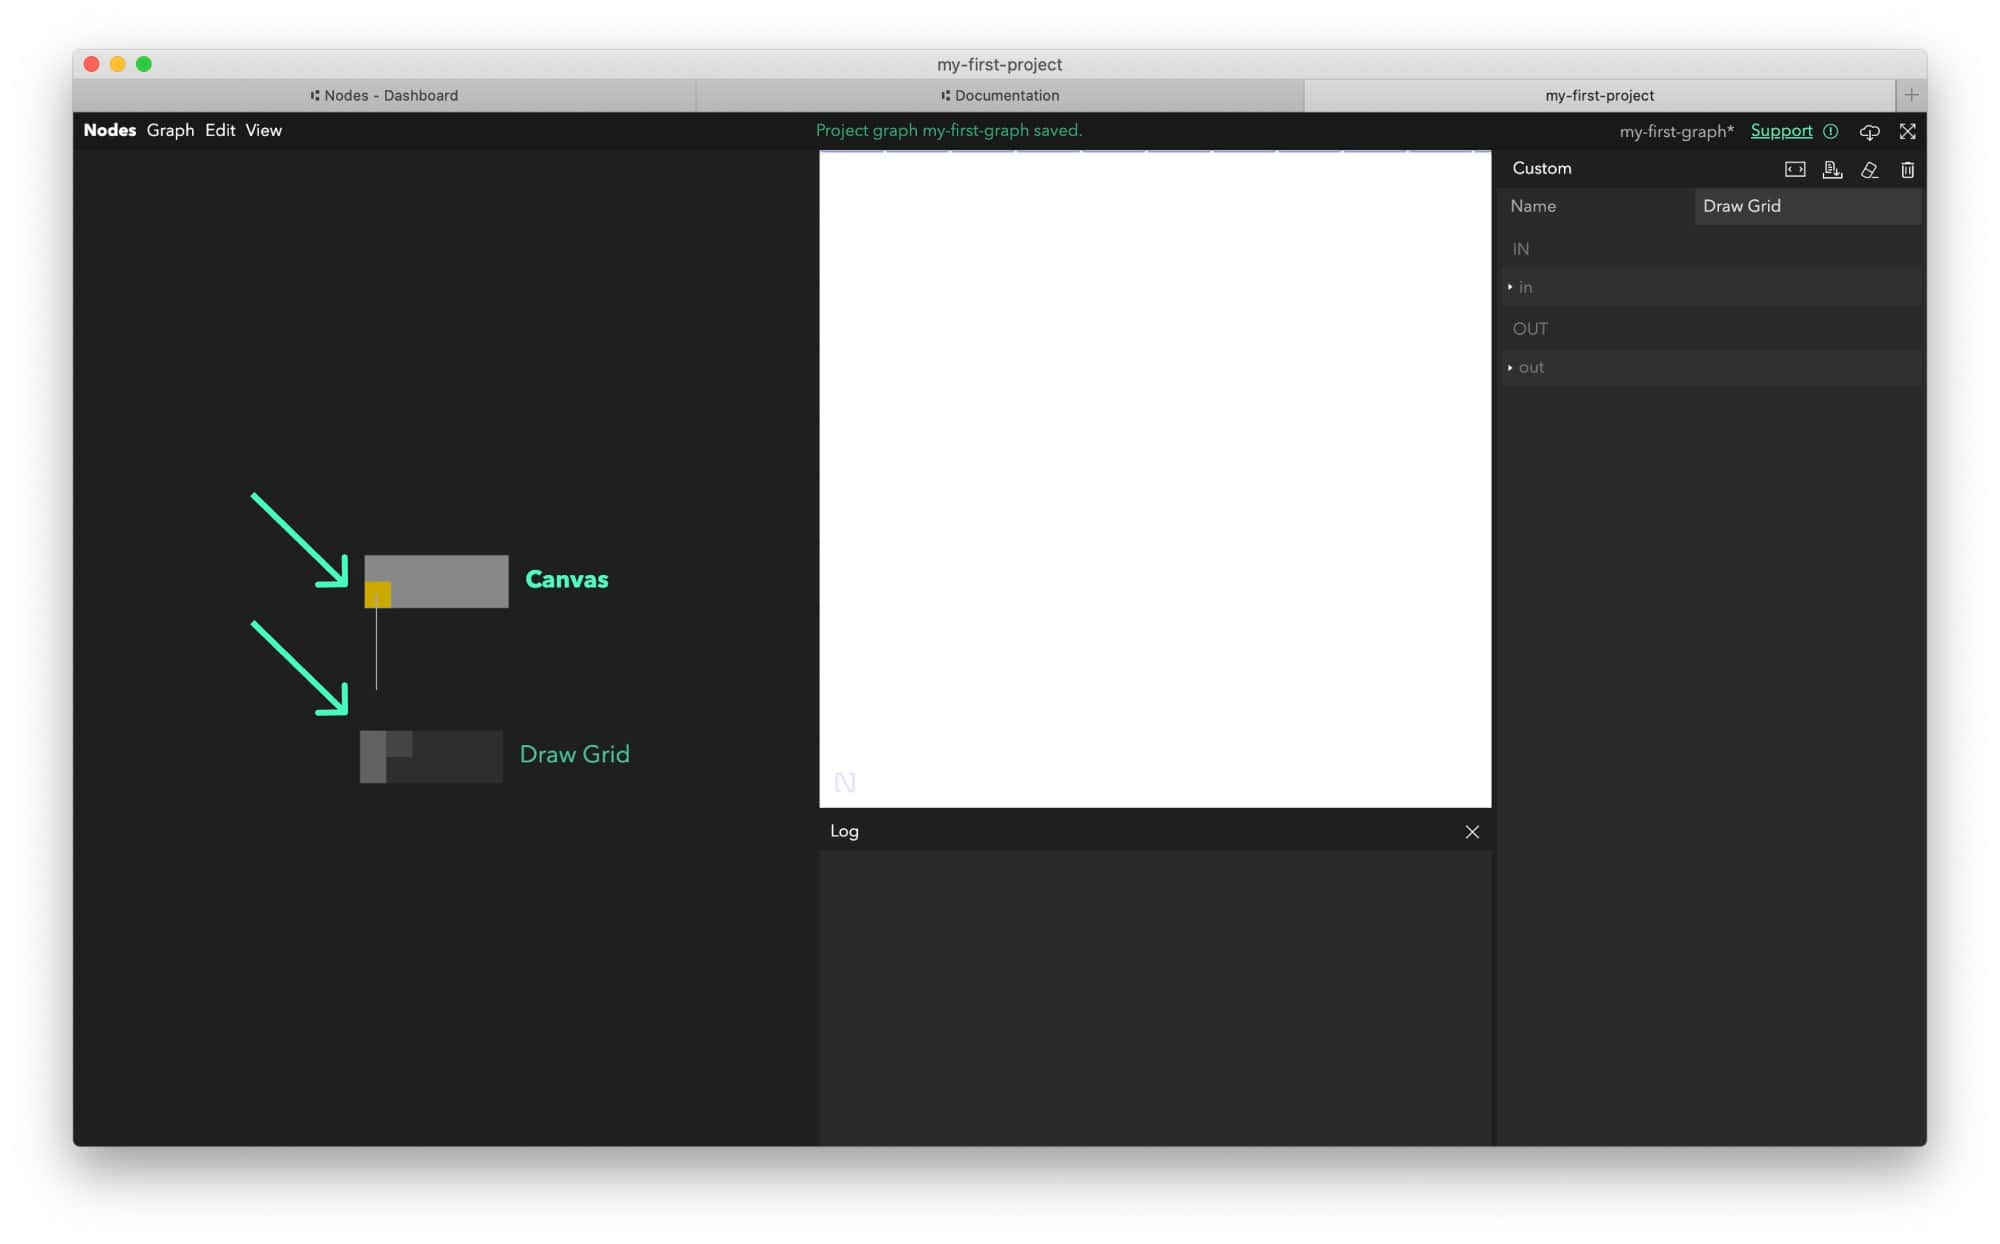
- Double click on the Graph Editor (the empty area on the left of the window) and choose
Customnode template:
A block representing the newly created node should appear:
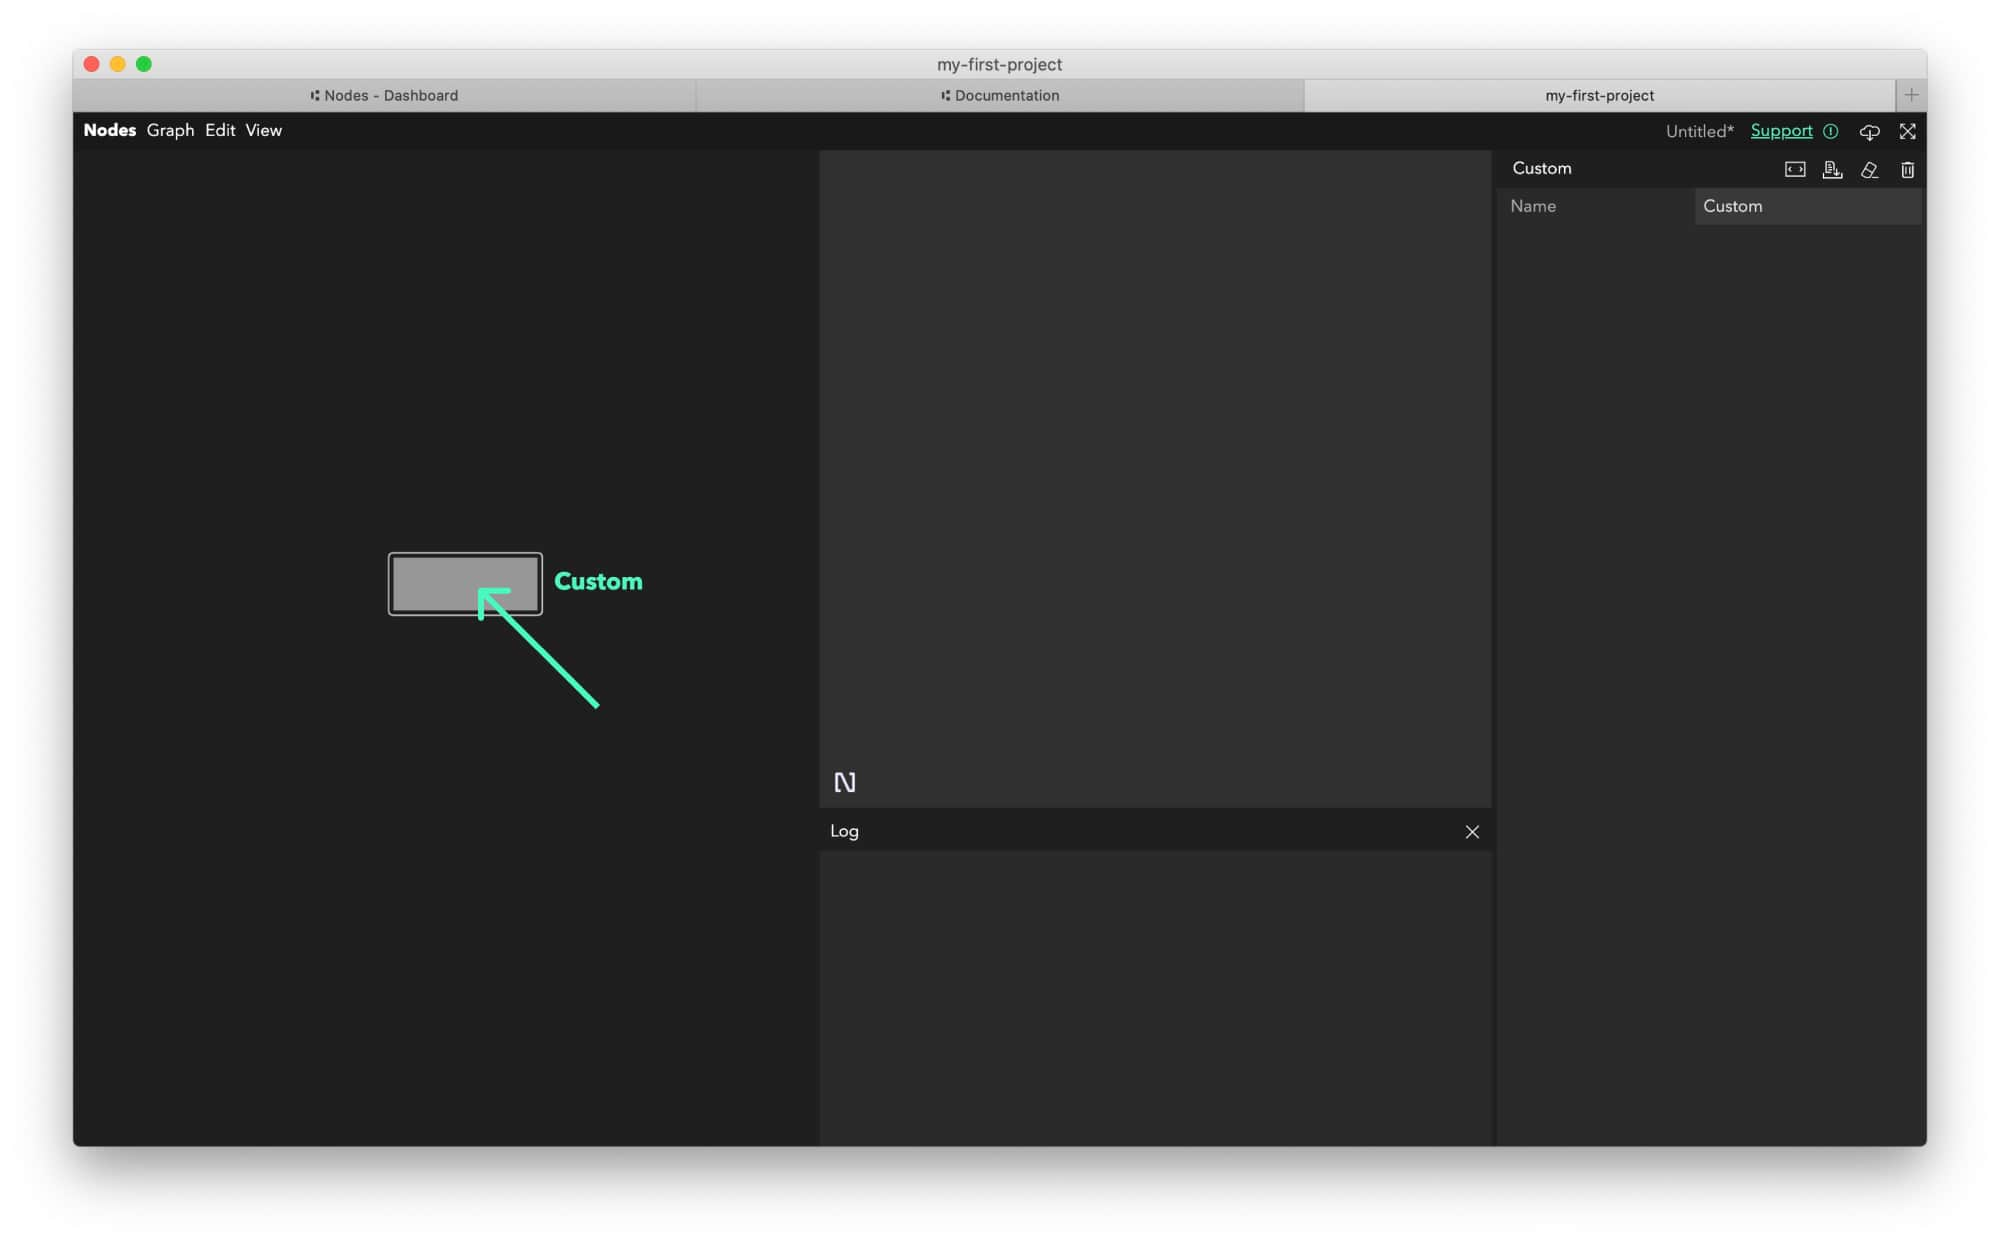
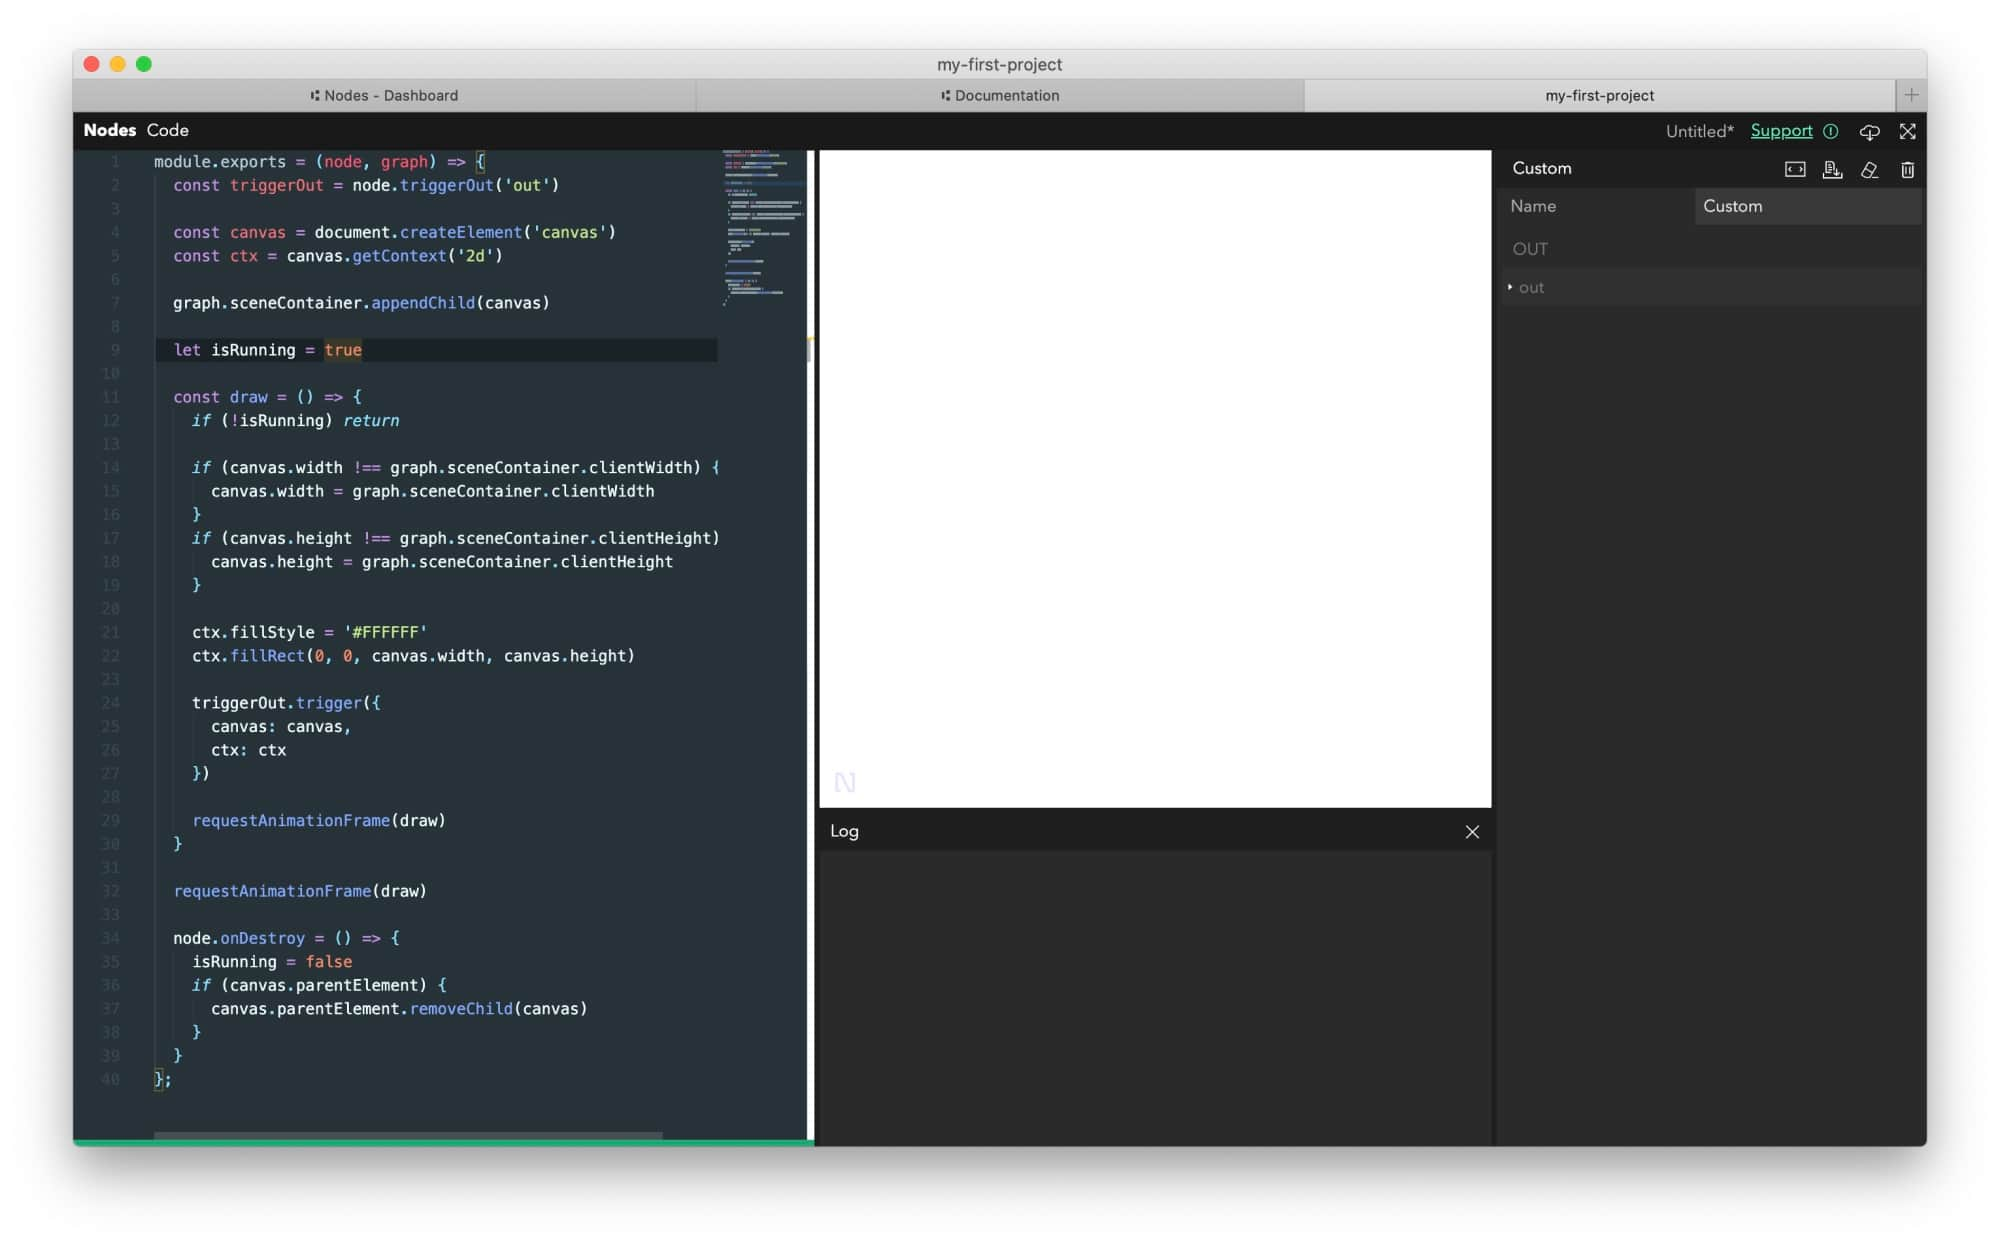
- Double click on that node to open the Code editor.
- Copy and paste the code below.
- Press
Shift + Enterto compile it. - Press
Esc(Code > Close Editor in the menu) to close the Code editor and go back to the Graph Editor.
// Node code definition follows a CommonJS-like module specification
module.exports = (node, graph) => {
	// create output trigger port we will use to send data to child nodes
	const triggerOut = node.triggerOut("out");

	// create a html canvas we will use for drawing
	const canvas = document.createElement("canvas");

	canvas.style.width = "100%";
	canvas.style.height = "100%";

	// get the 2d drawing context we will use to issue drawing commands
	const ctx = canvas.getContext("2d");

	// add canvas element to the Nodes Scene
	graph.sceneContainer.appendChild(canvas);

	// flag tracking if we are still runing to break requestAnimationFrame loop
	let isRunning = true;

	// this function is our main loop, it should be called 60 times per second
	const draw = () => {
		// stop drawing if the node has been destroyed or recompiled
		if (!isRunning) return;

		// check if canvas size matches the Nodes' scene parent size
		// if not, resize accordingly
		if (canvas.width !== graph.sceneContainer.clientWidth) {
			canvas.width = graph.sceneContainer.clientWidth;
		}
		if (canvas.height !== graph.sceneContainer.clientHeight) {
			canvas.height = graph.sceneContainer.clientHeight;
		}

		// clean canvas background with white color
		ctx.fillStyle = "#FFFFFF";
		ctx.fillRect(0, 0, canvas.width, canvas.height);

		// send canvas and drawing context to child nodes
		triggerOut.trigger({
			canvas: canvas,
			ctx: ctx,
		});

		// request drawing of the next frame
		requestAnimationFrame(draw);
	};

	// start animation loop
	requestAnimationFrame(draw);

	// this code will be executed when node is deleted or recompiled
	node.onDestroy = () => {
		// set the flag to stop drawing
		isRunning = false;
		// remove the canvas element from the Scene
		if (canvas) {
			canvas.remove();
		}
	};
};
A white rectangle should appear in the Scene. This is our canvas: we will use it to draw the generative poster.
Tip: Want to learn more about HTML Canvas? Visit Canvas API tutorial on MDN.
Congratulations! You have created your first node :)
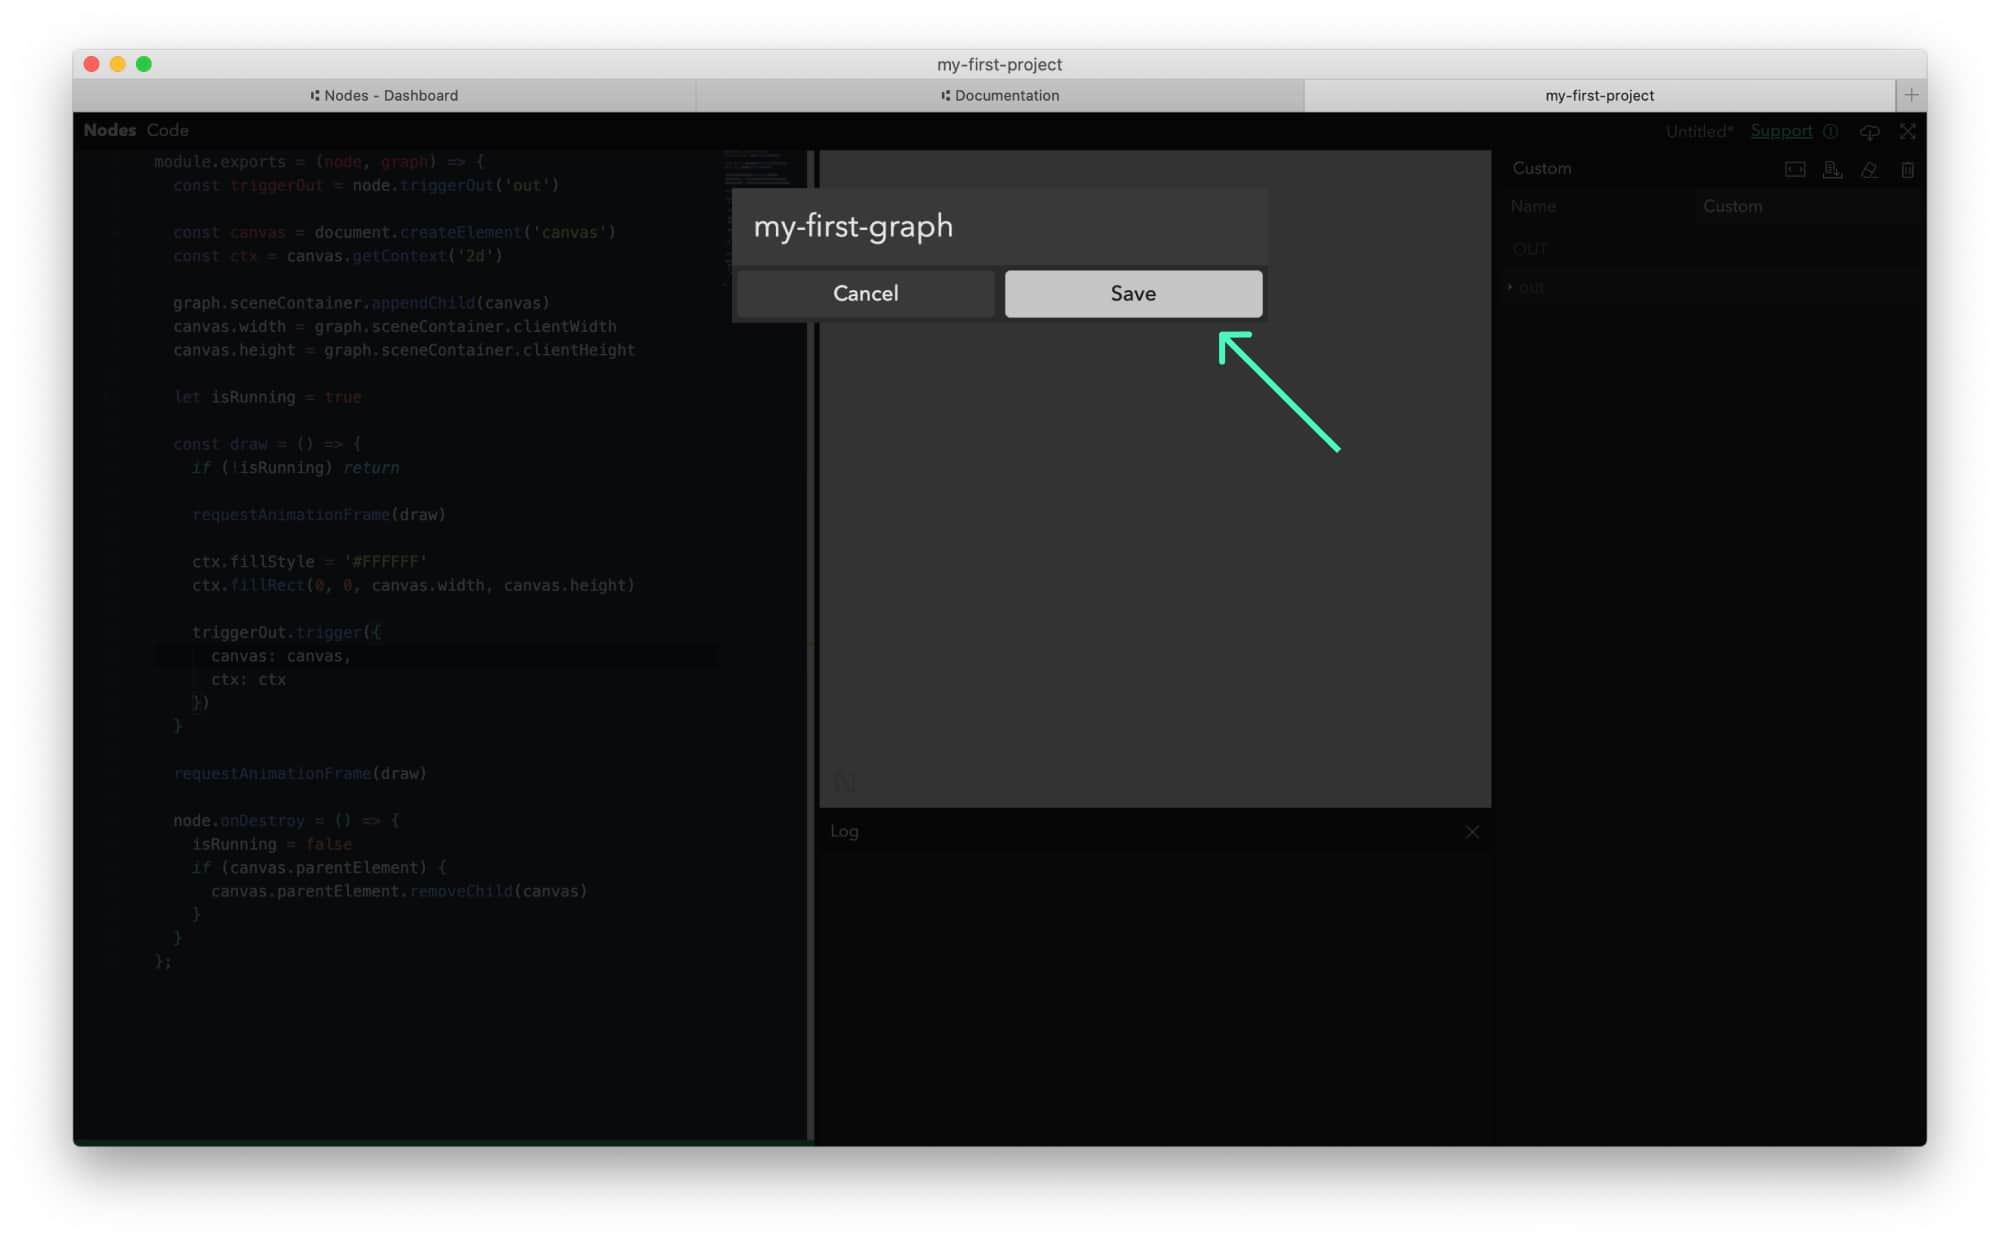
Now is probably a good time to save your project by pressing Cmd/Ctrl+S (Graph > Save in the menu). You should see a popup asking for a graph name: enter my-first-graph or whichever name you’d like.
Note: Each Nodes project consist of one or several graph(s) sharing some code, assets and 3rd party packages.
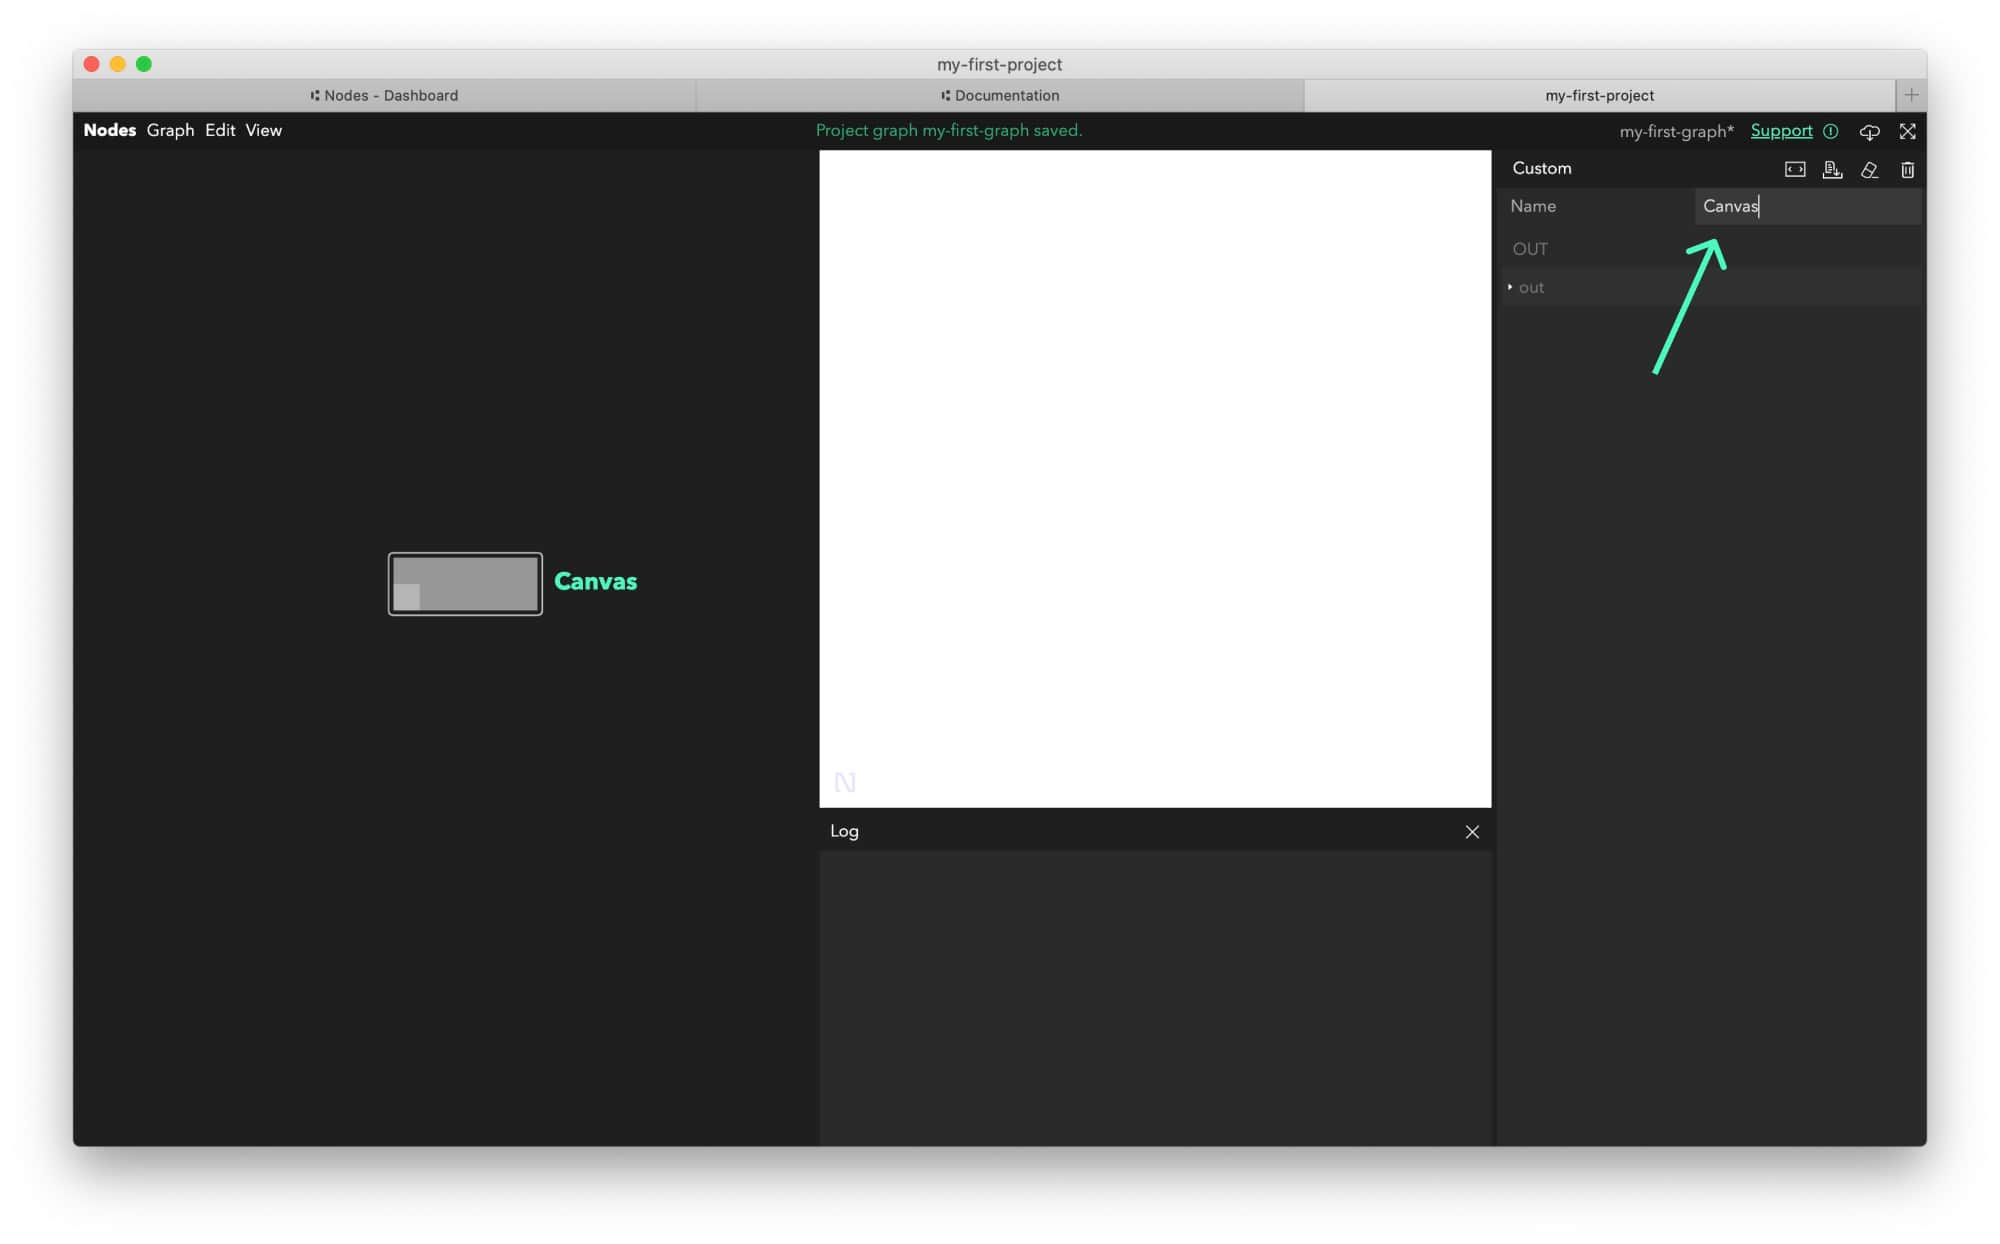
Our Canvas node is still named Custom. Let’s change that. Click on the node in the Graph Editor and change its name in the Inspector on the right side and confirm by pressing Enter.
Note: This might seem like a lot of code but you will only have to do it once! You have now created a self contained Canvas node that you can copy-paste to other graphs and projects simply using Cmd/Ctrl+C + Cmd/Ctrl+V on the Graph Editor.
Add a grid
As a next step, we will draw a grid of rectangles by creating two nested loops. One for the X-axis and one for the Y-axis, moving by step pixels in a given direction on every step.
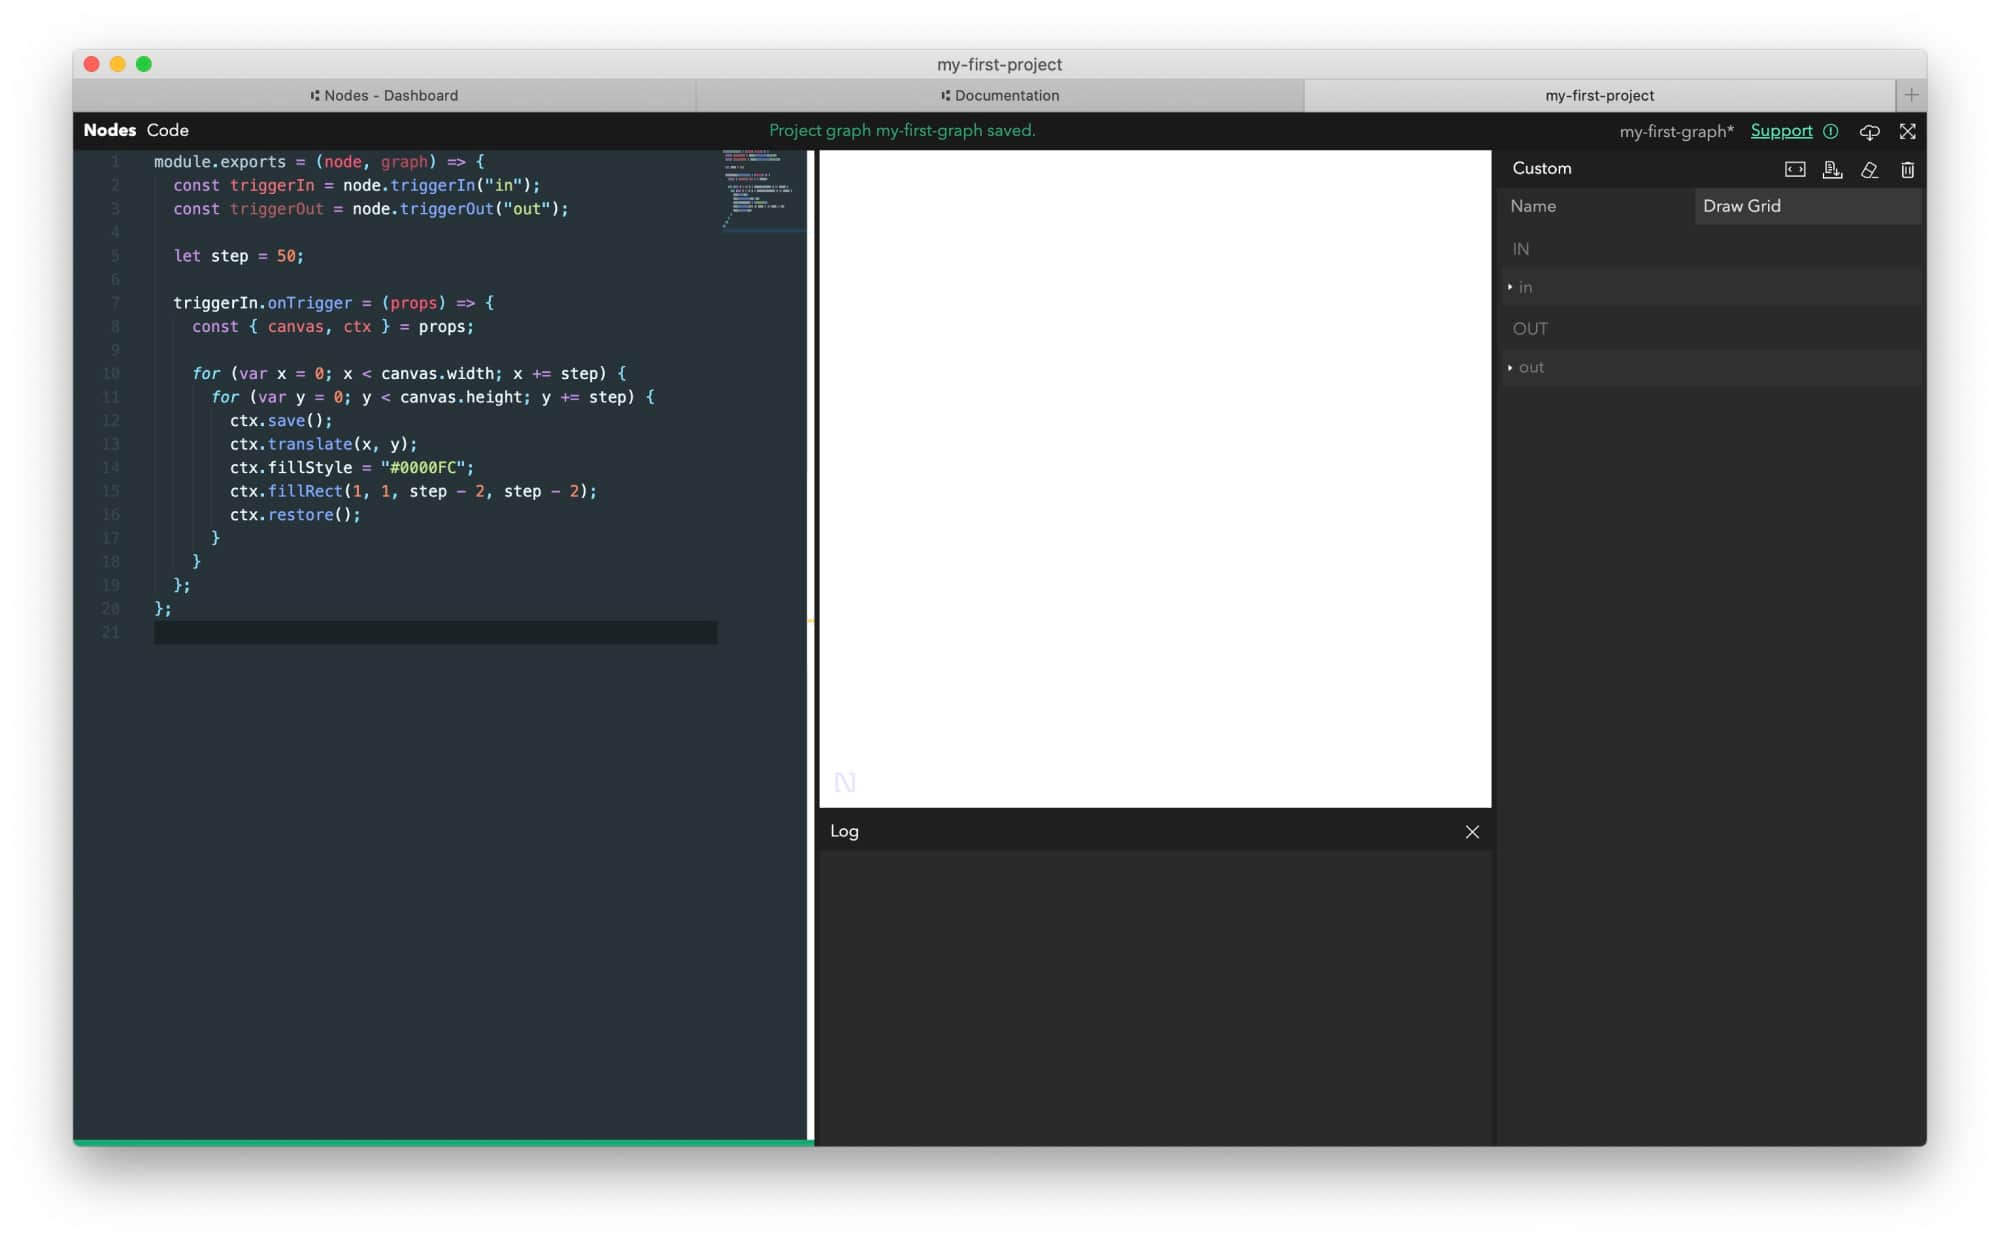
- Create another
Customnode and rename it toDraw Grid.
Add the following code to it:
module.exports = (node, graph) => {
	// create input trigger port we will use to receive data from parent node
	const triggerIn = node.triggerIn("in");
	// create output trigger port we will use to send data to child nodes
	const triggerOut = node.triggerOut("out");

	// size of each rectangles
	const step = 50;

	// we receive data from parent node on each frame
	// this is where we will draw our grid
	triggerIn.onTrigger = (props) => {
		// destructure canvas and context from the received properties
		const { canvas, ctx } = props;

		// draw a grid moving by "step" pixels to the right and down in a loop
		for (let x = 0; x < canvas.width; x += step) {
			for (let y = 0; y < canvas.height; y += step) {
				// save current canvas state
				ctx.save();

				// move "drawing pen" to x, y positions
				ctx.translate(x, y);

				// set fill color to Nodes Blue
				ctx.fillStyle = "#0001f2";

				// draw rectangle at the current "pen position"
				ctx.fillRect(1, 1, step - 2, step - 2);

				// restore canvas state to before translation
				ctx.restore();
			}
		}
	};
};
- Press
Shift+Enterto compile the node.
Nothing should change on the screen just yet.
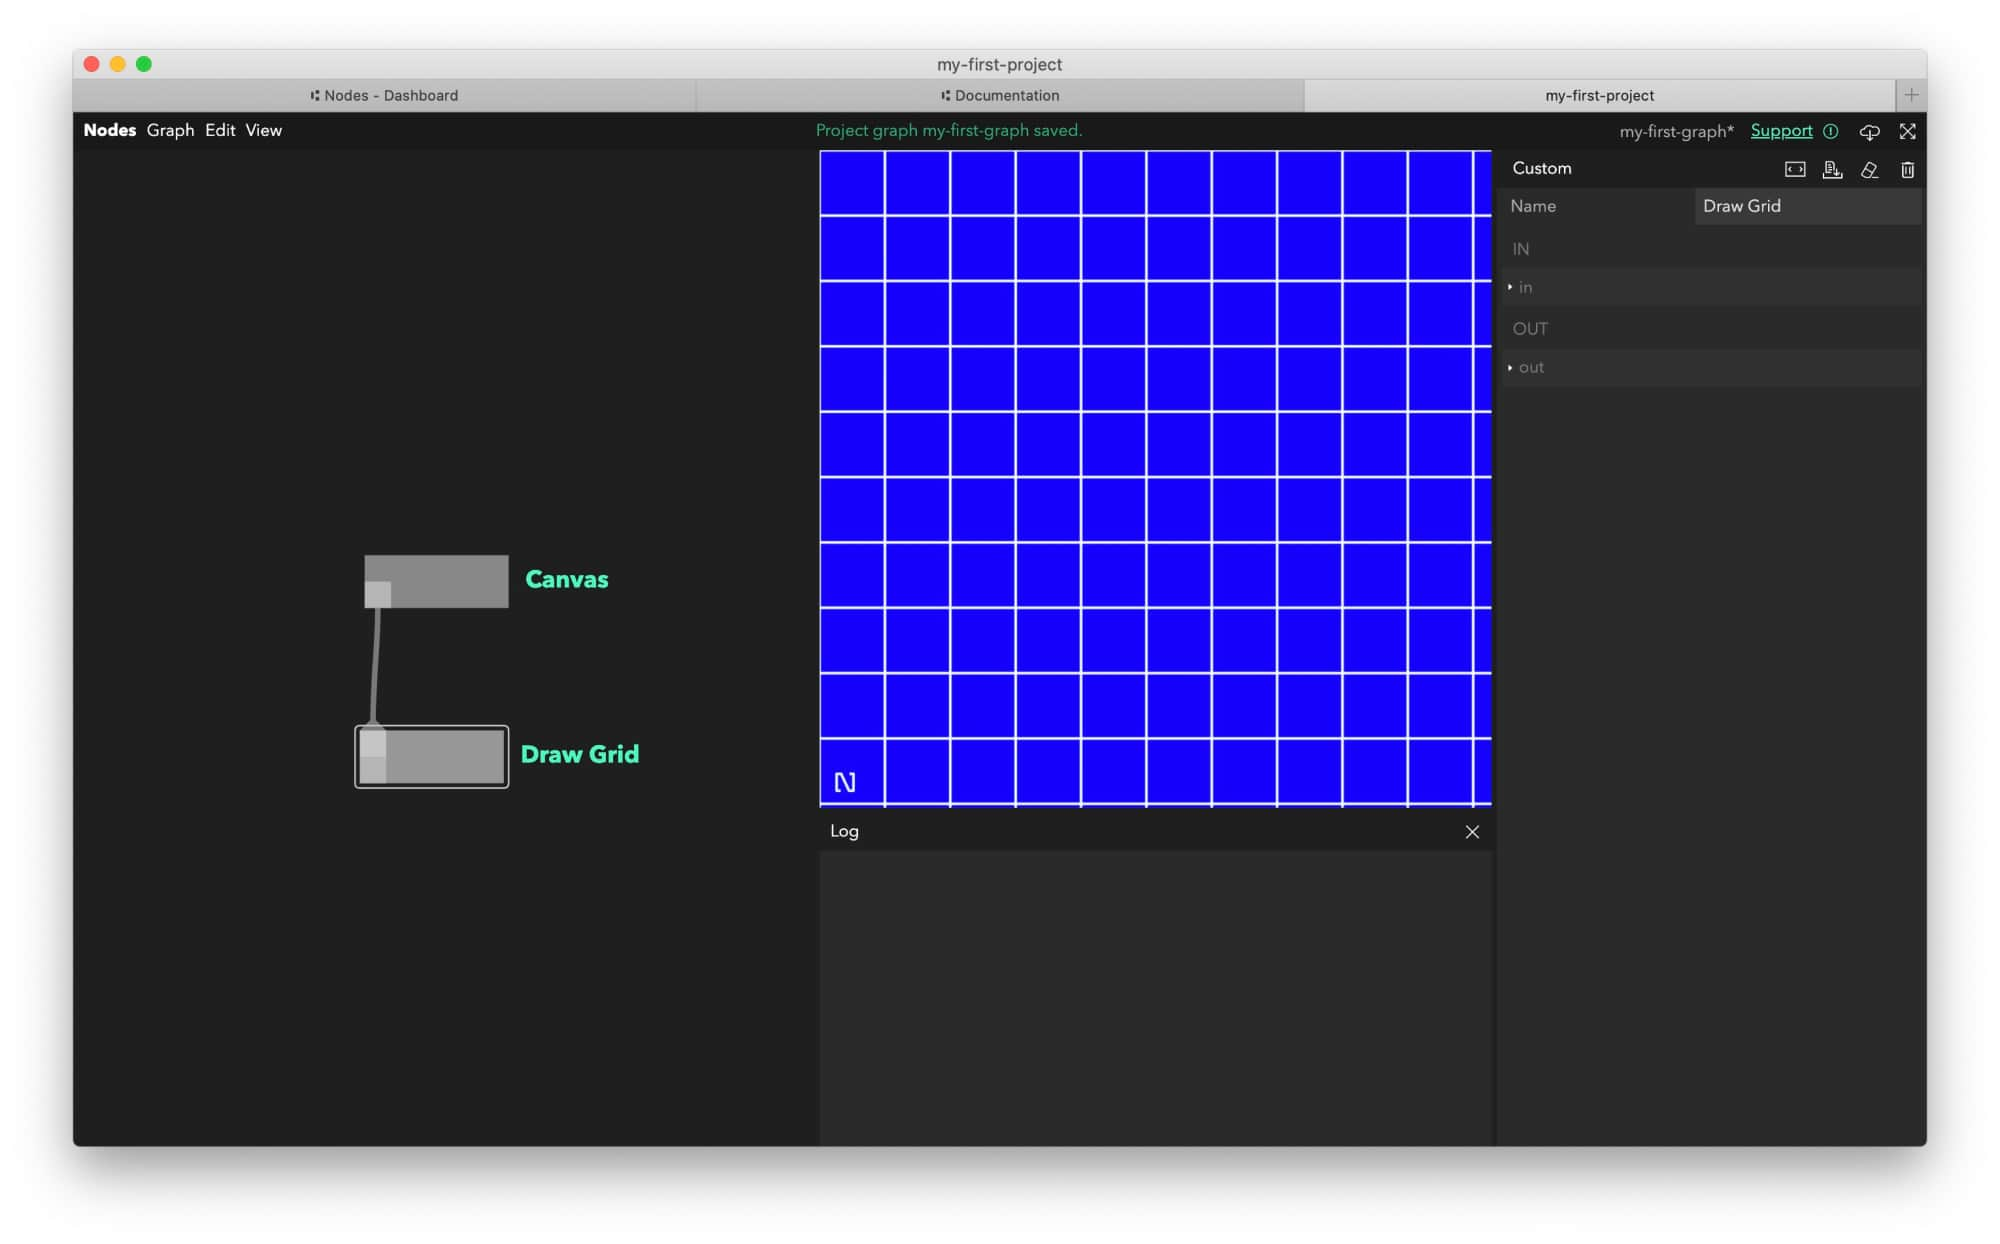
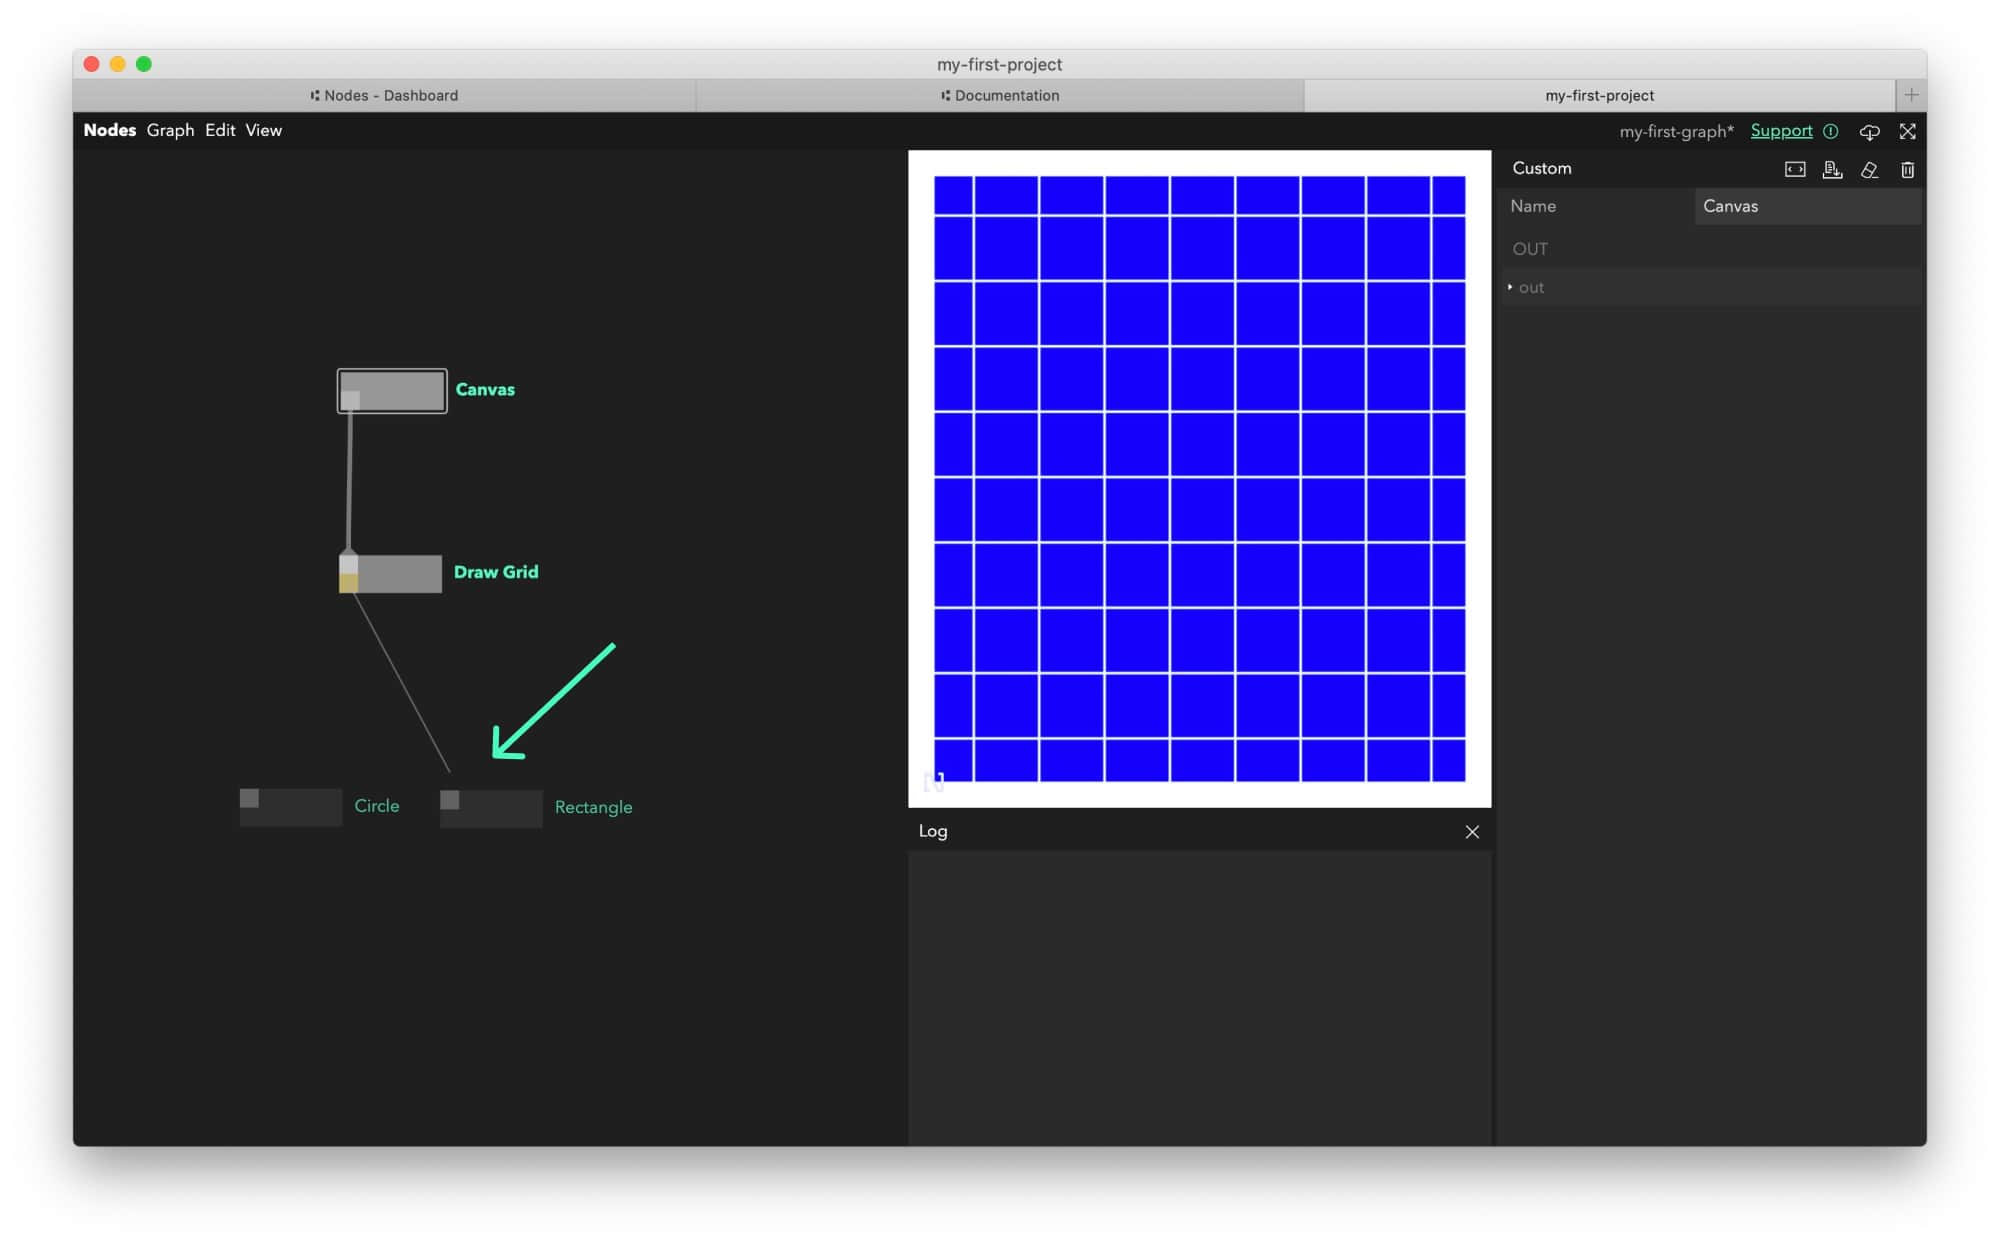
Back in the Graph Editor (Esc), click on the first square of the Canvas node (representing the node’s out port) and keeping the left mouse button down, drag a connection to the in port of Draw Grid canvas.
Once connected a blue grid should appear.
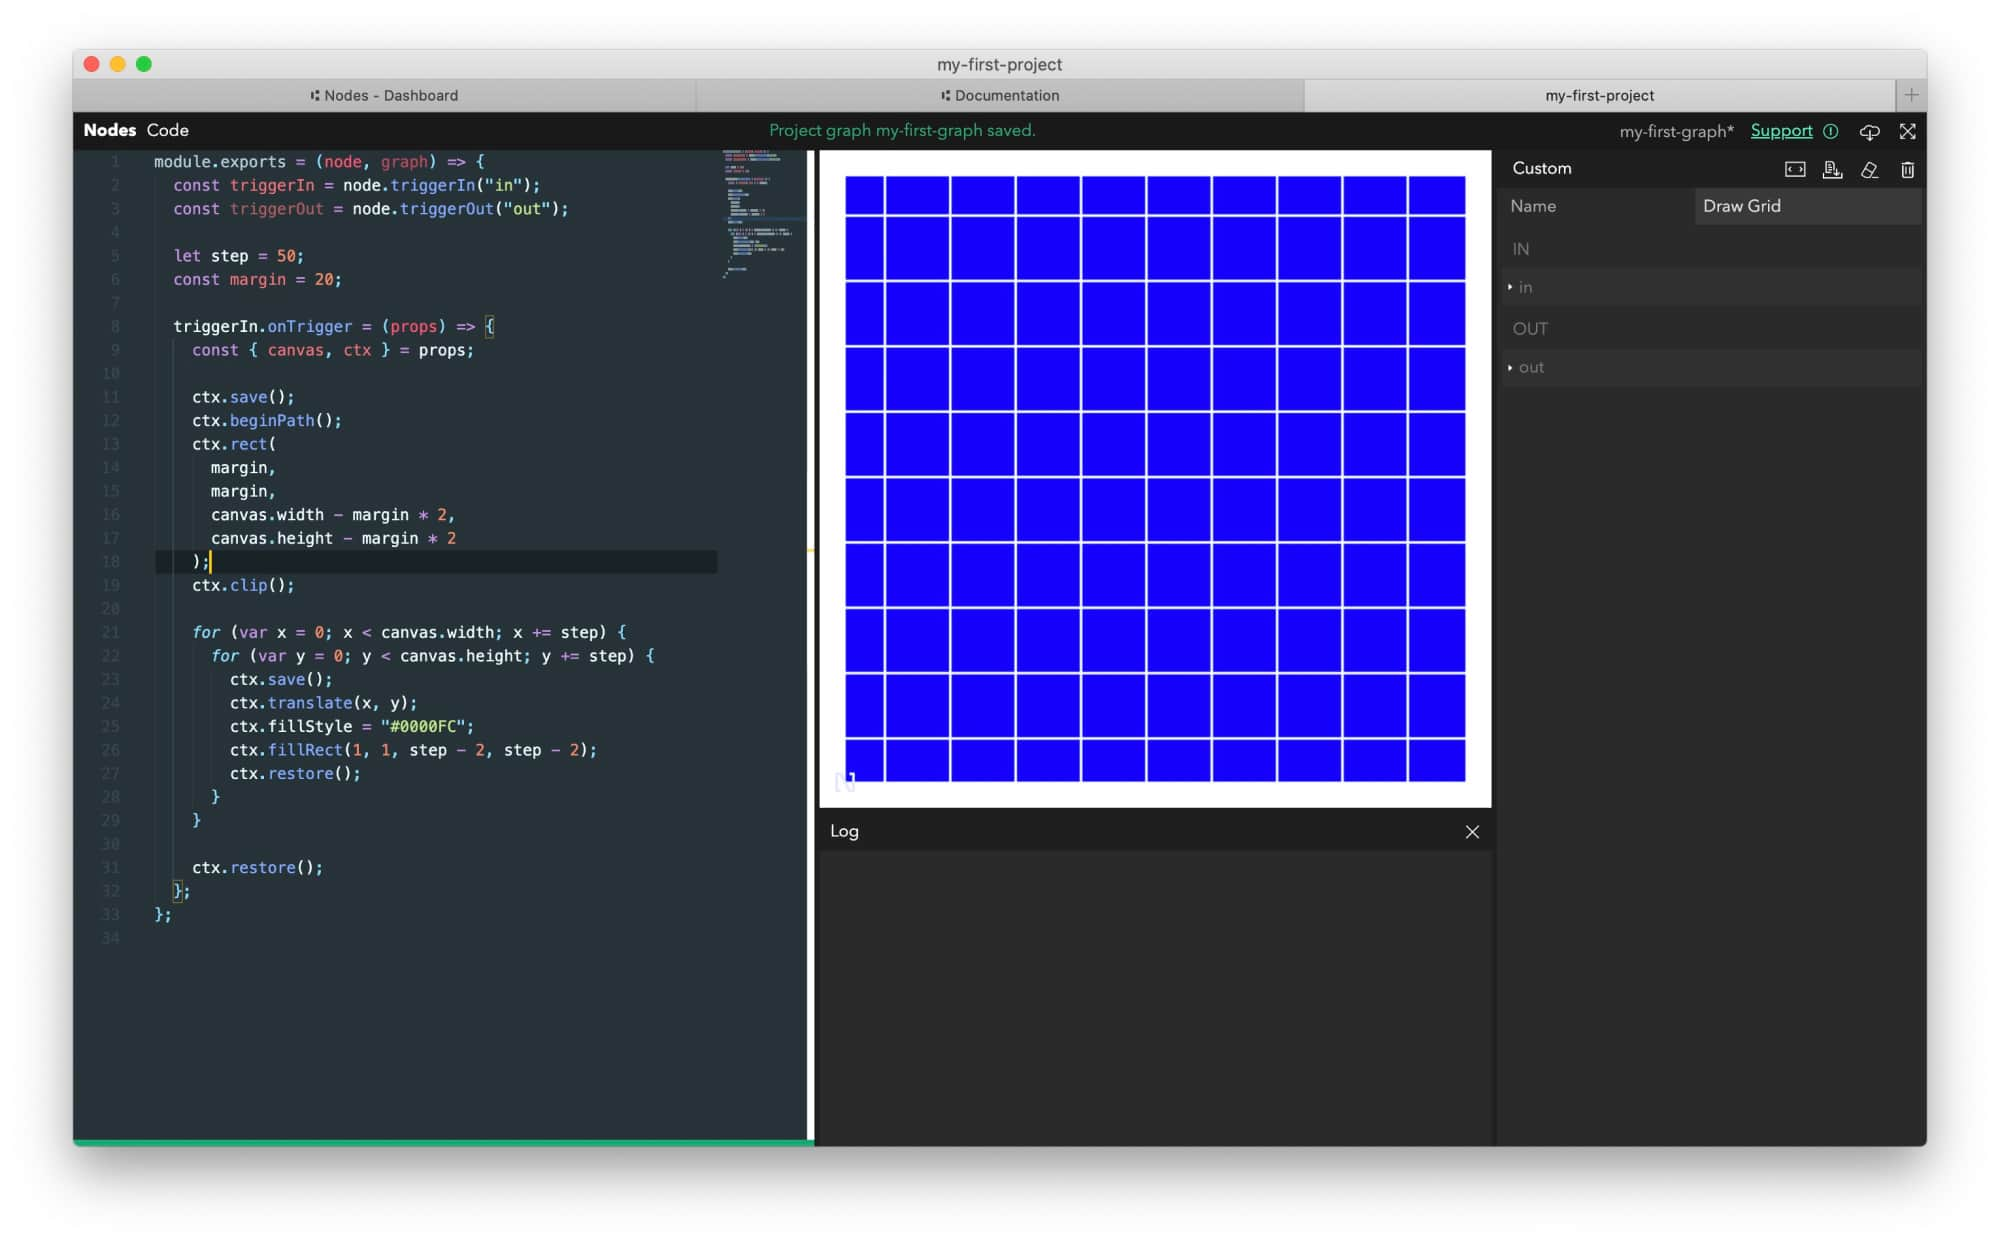
Let’s make it breathe a bit by adding margins like they would appear on a print using the HTML Canvas clipping mask feature.
You can see which lines are new by following the comments below but feel free to copy and replace the whole code in the Draw Grid node:
module.exports = (node, graph) => {
	const triggerIn = node.triggerIn("in");
	const triggerOut = node.triggerOut("out");

	let step = 50;

	// margin size in pixels
	const margin = 20;

	triggerIn.onTrigger = (props) => {
		const { canvas, ctx } = props;

		// save canvas state
		ctx.save();

		// start drawing clipping mask
		ctx.beginPath();

		// draw clipping mask rectangle slightly smaller than whole page
		ctx.rect(
			margin,
			margin,
			canvas.width - margin * 2,
			canvas.height - margin * 2,
		);
		ctx.clip();

		for (let x = 0; x < canvas.width; x += step) {
			for (let y = 0; y < canvas.height; y += step) {
				ctx.save();
				ctx.translate(x, y);
				ctx.fillStyle = "#0000FC";
				ctx.fillRect(1, 1, step - 2, step - 2);
				ctx.restore();
			}
		}

		// restore canvas state effectively disabling clipping
		ctx.restore();
	};
};
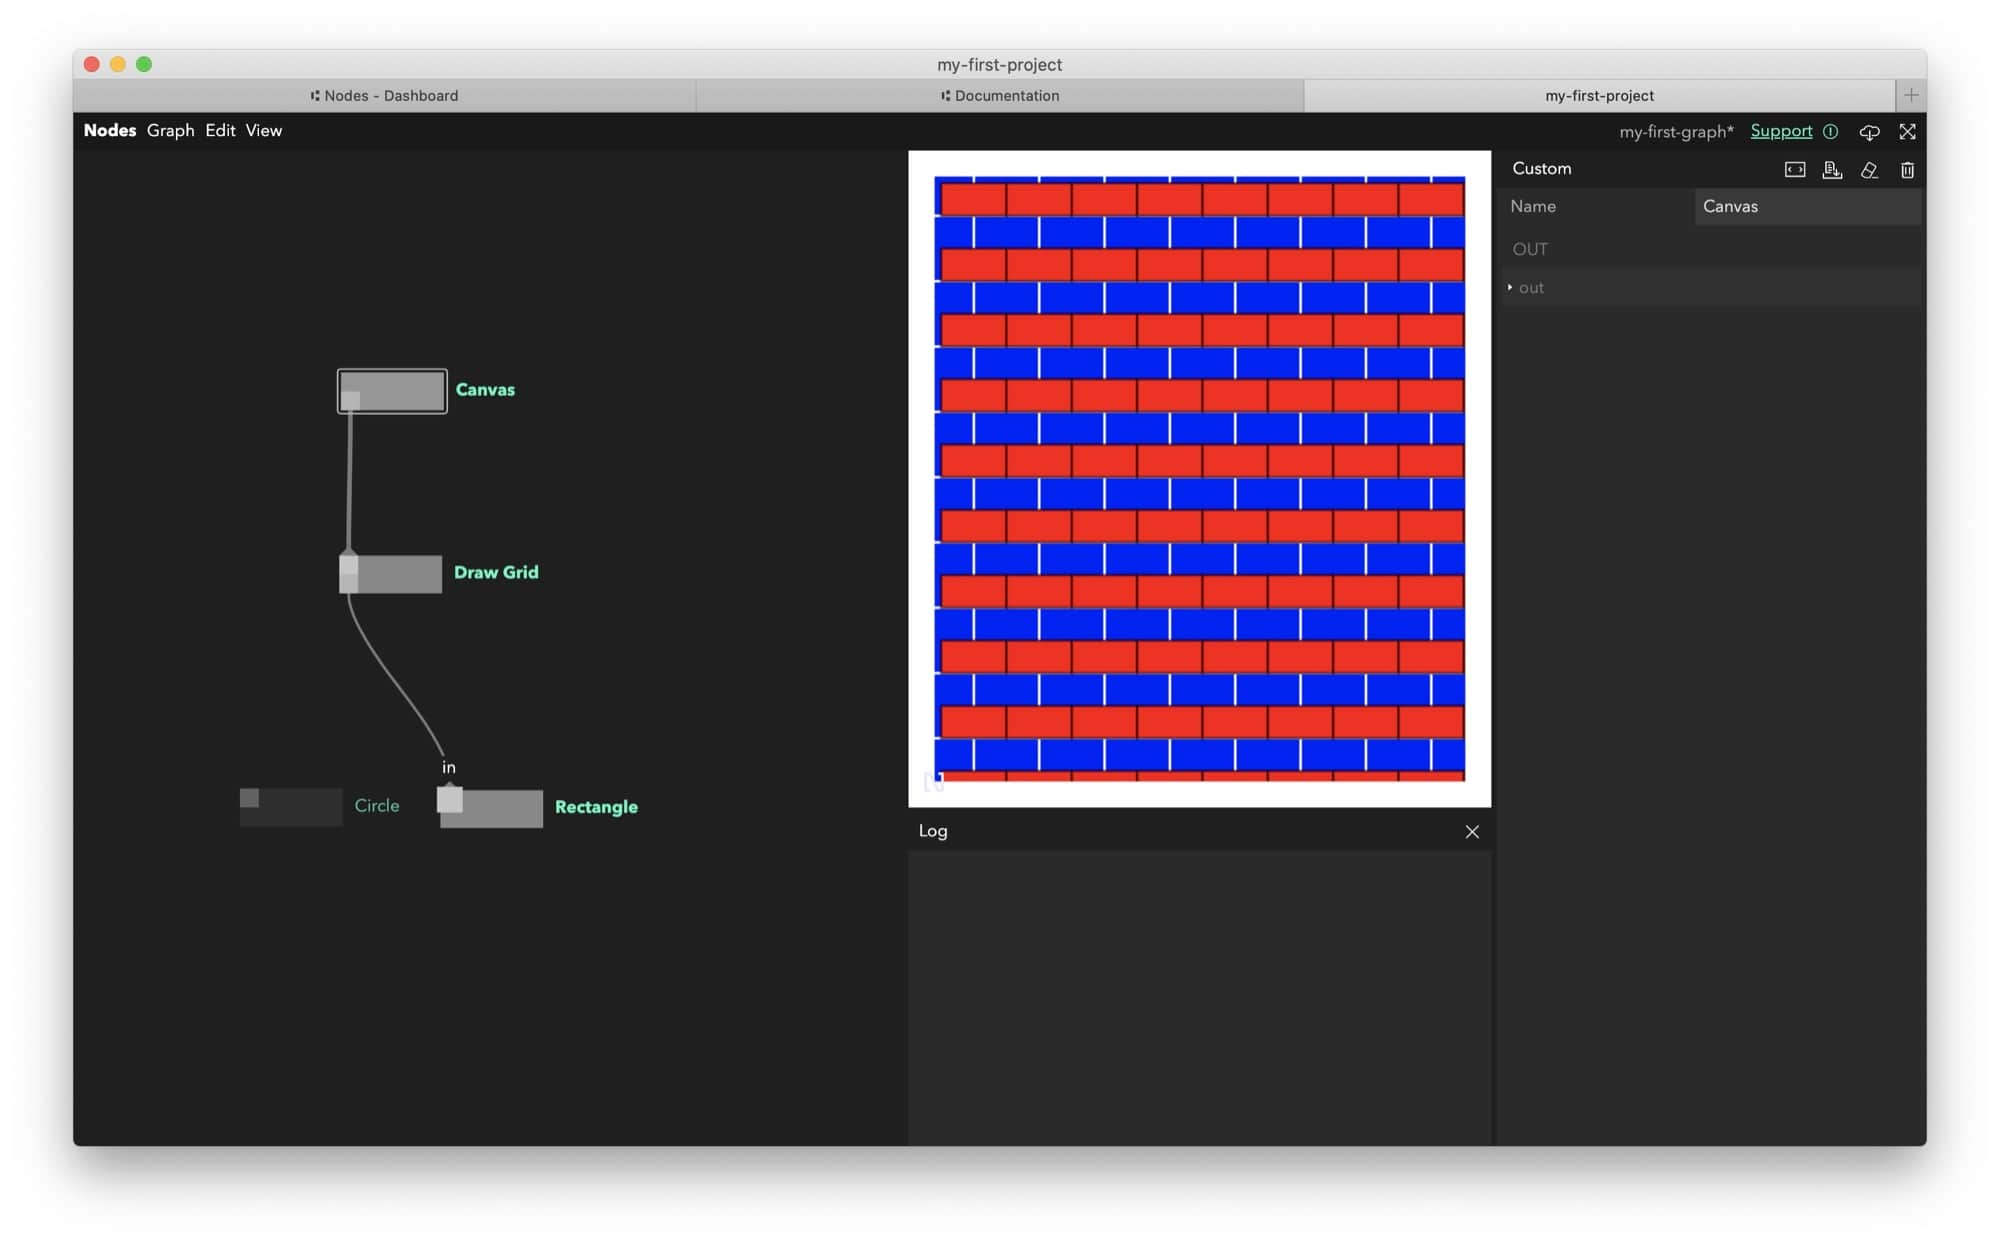
And here is the effect. Much better!
Add grid items
We are now ready to draw shapes on our grid.
- Add another set of nested
forloops after the ones we already have and just before thectx.restore()call. Each child node will be rendered with the same properties we received from the parentCanvasnode likecanvasandctxbut with additionalindexandsize(size of the shape to be drawn) added.
let index = 0;
for (let x = 0; x < canvas.width; x += step) {
	for (let y = 0; y < canvas.height; y += step) {
		ctx.save();
		ctx.translate(x, y);

		// move to the center of the grid cell
		ctx.translate(step / 2, step / 2);

		// trigger output port effectively drawing child nodes
		// with additional `size` and `index` properties
		triggerOut.trigger({
			...props,
			index,
			size: step,
		});

		ctx.restore();

		index++;
	}
}
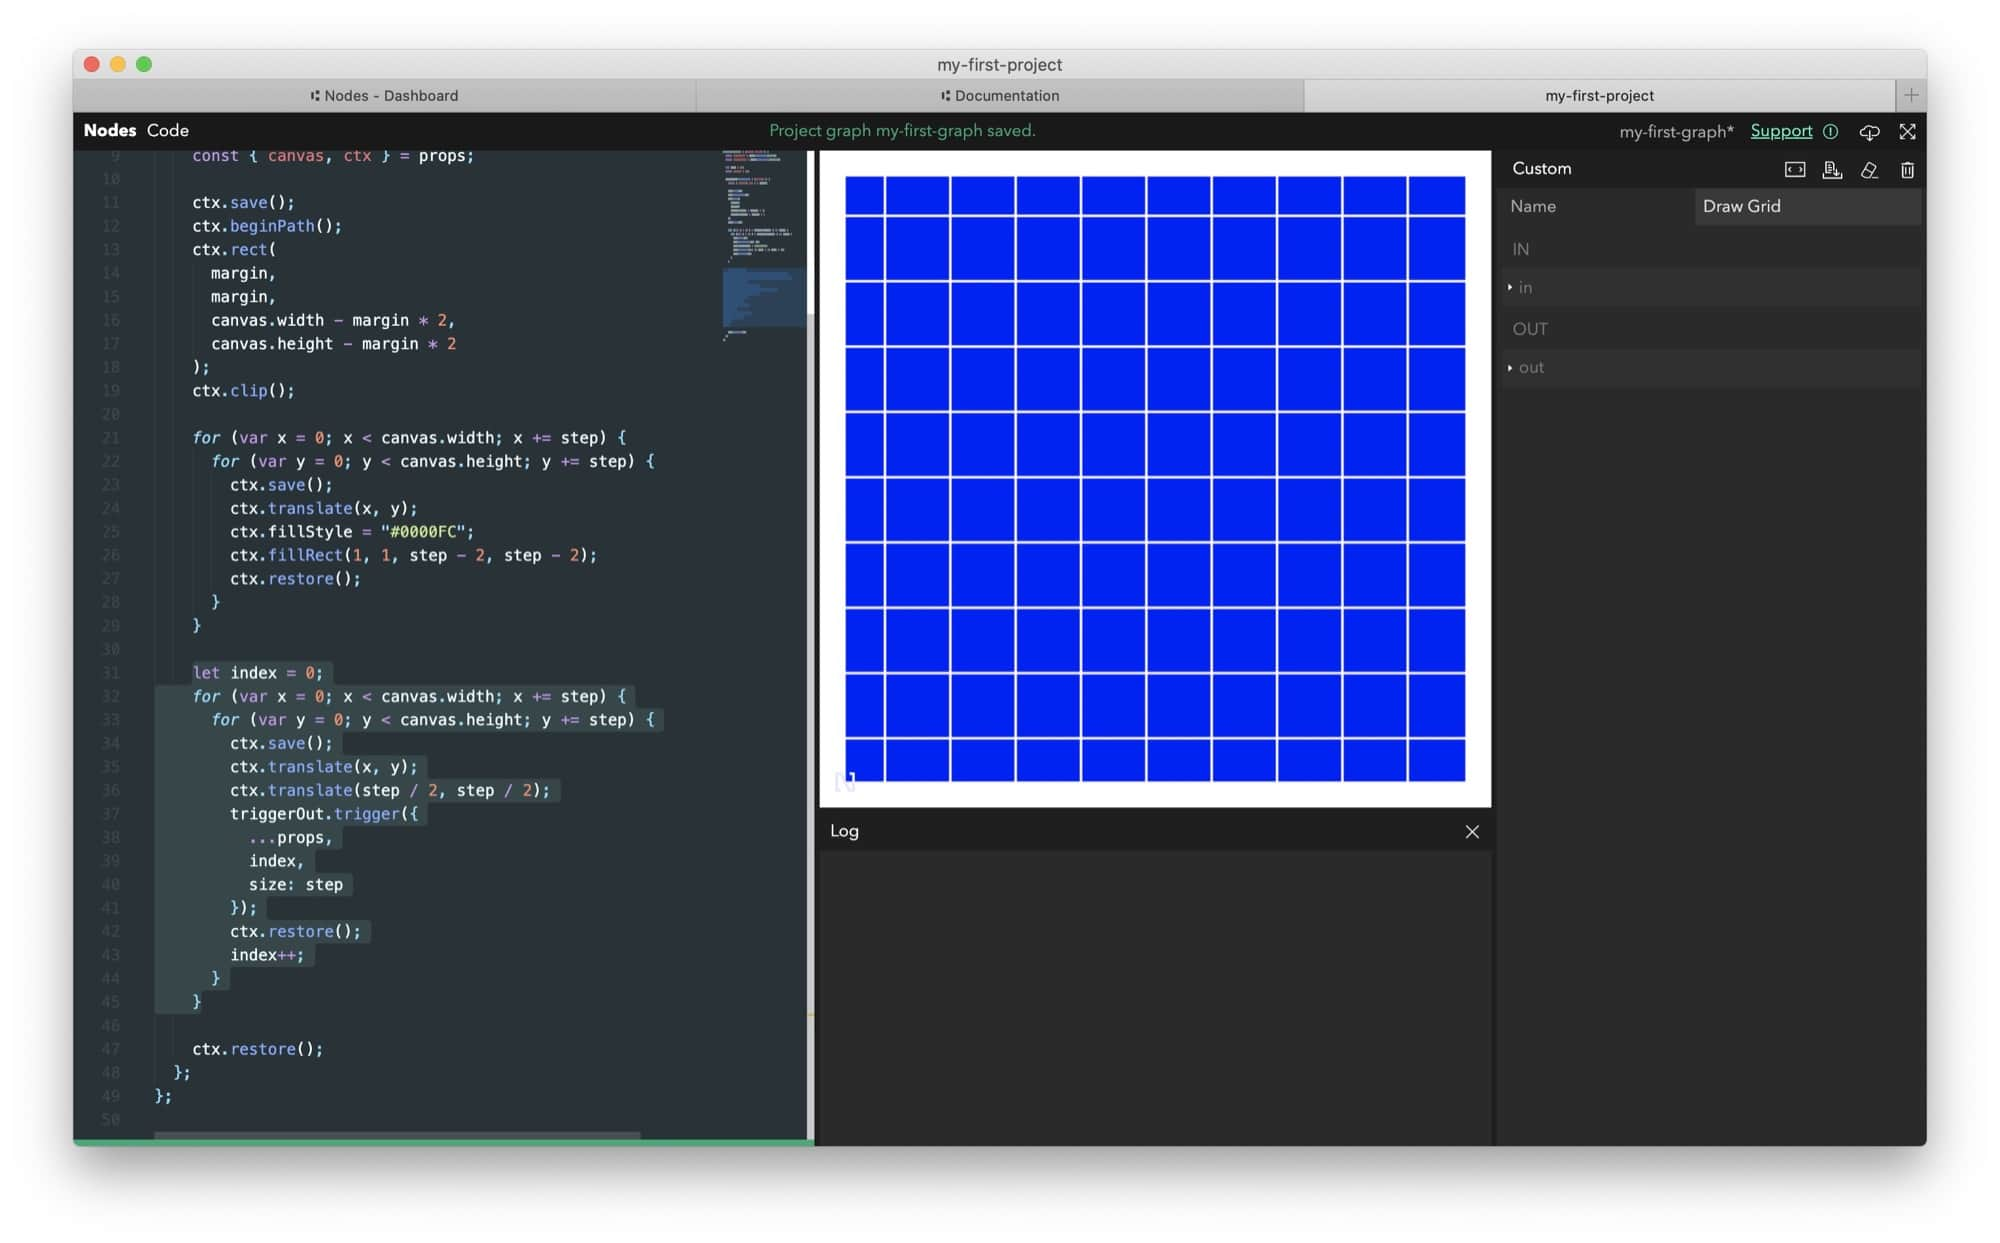
Nothing will happen just yet. We still need to draw the actual shape. Let’s start with a circle:
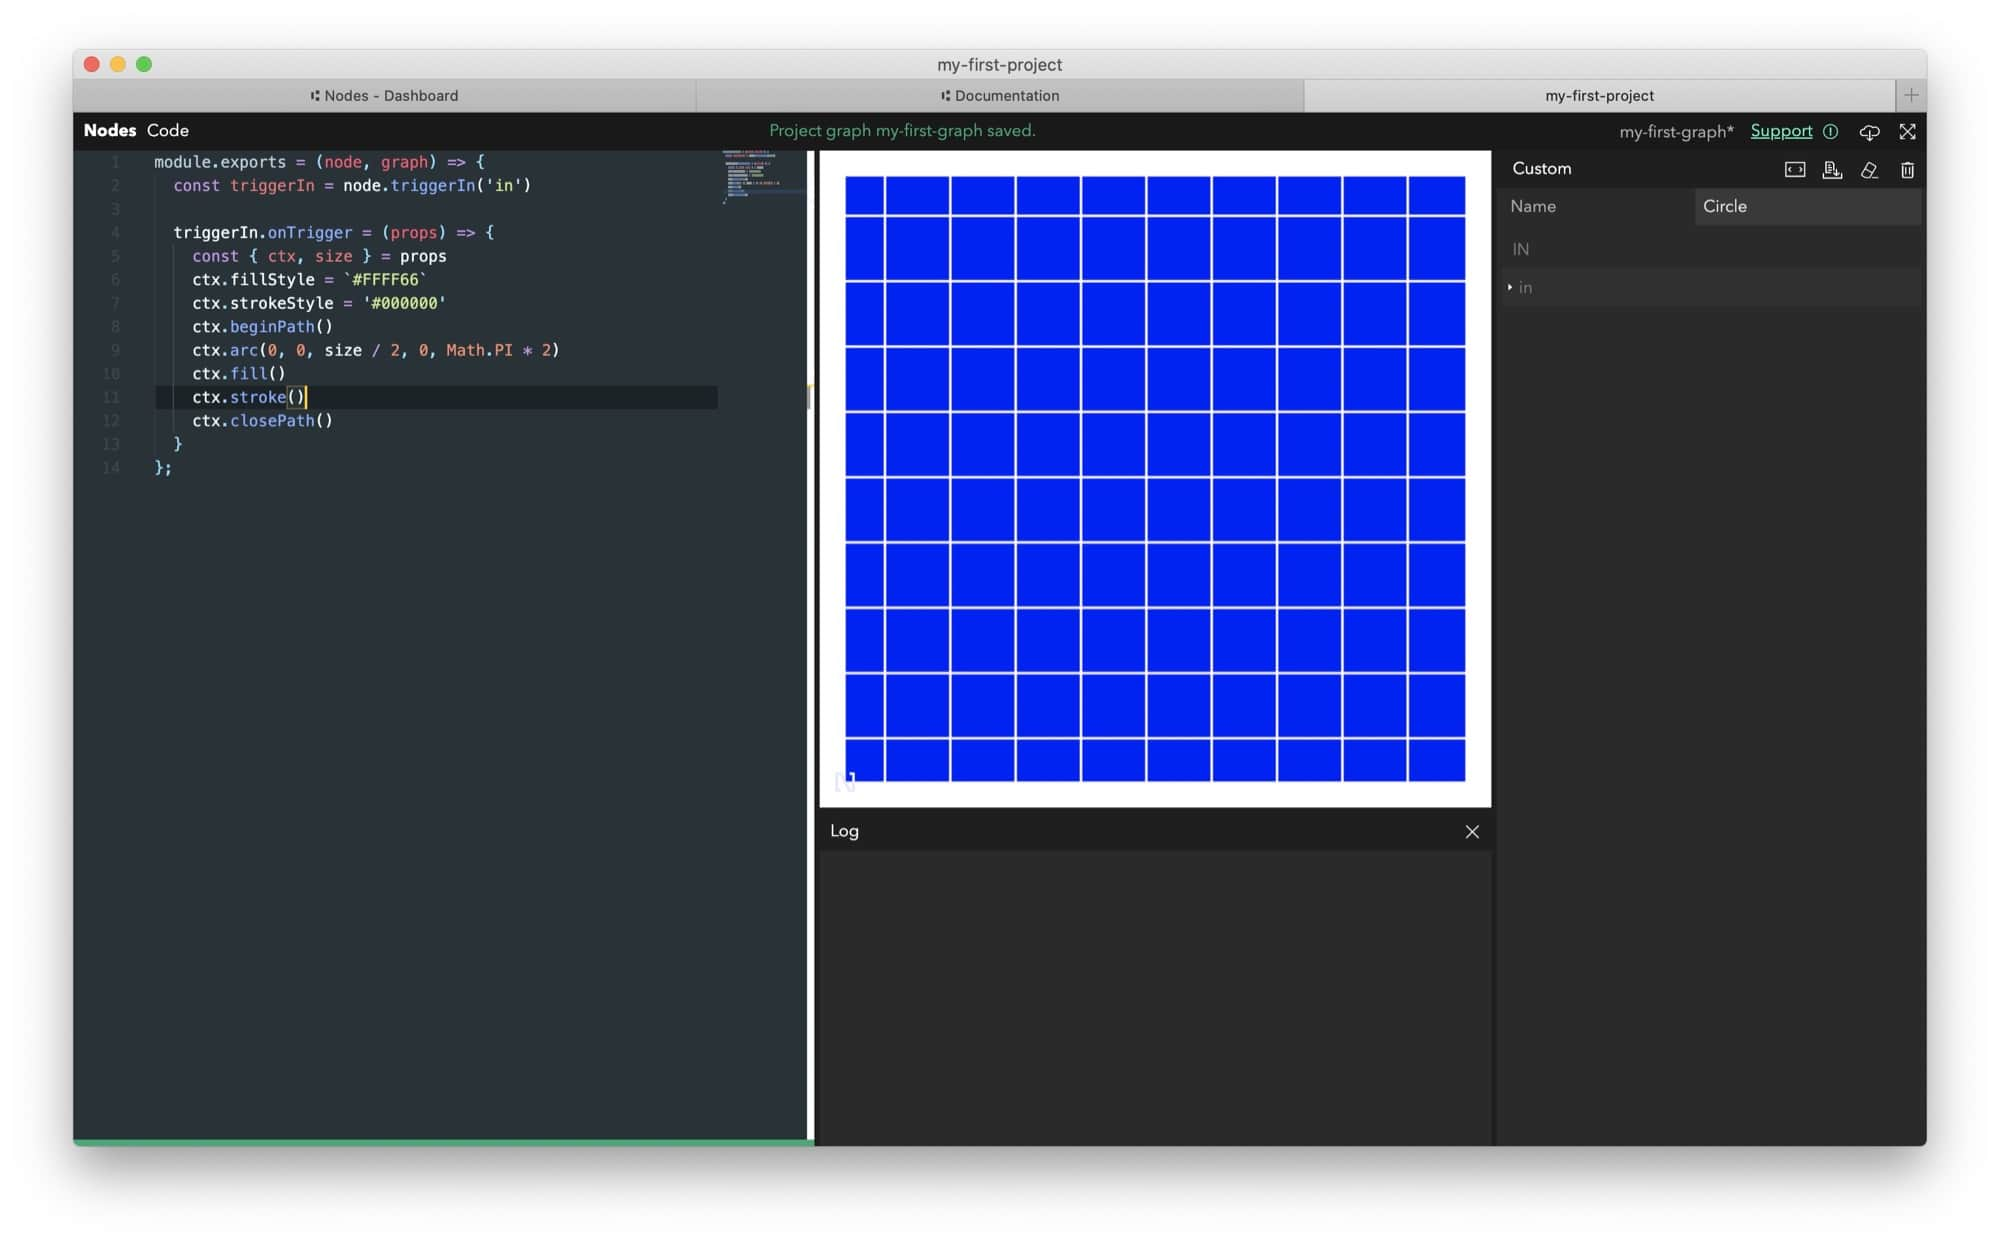
- Create a new
Customnode. - Rename it to
Circle. - Copy the code below and recompile.
module.exports = (node, graph) => {
	const triggerIn = node.triggerIn("in");

	triggerIn.onTrigger = (props) => {
		const { ctx, size } = props;

		// set background color to pale yellow
		ctx.fillStyle = `#FFFF66`;

		// set border color to black
		ctx.strokeStyle = "#000000";

		// start drawing shape
		ctx.beginPath();

		// draw a circle arc
		// at position 0,0
		// with radius half the size of cell gride
		// and from 0 to 360 degrees (full scircle)
		ctx.arc(0, 0, size / 2, 0, Math.PI * 2);

		// fill the shape
		ctx.fill();

		// add border to the shape
		ctx.stroke();

		// finish drawing shape
		ctx.closePath();
	};
};
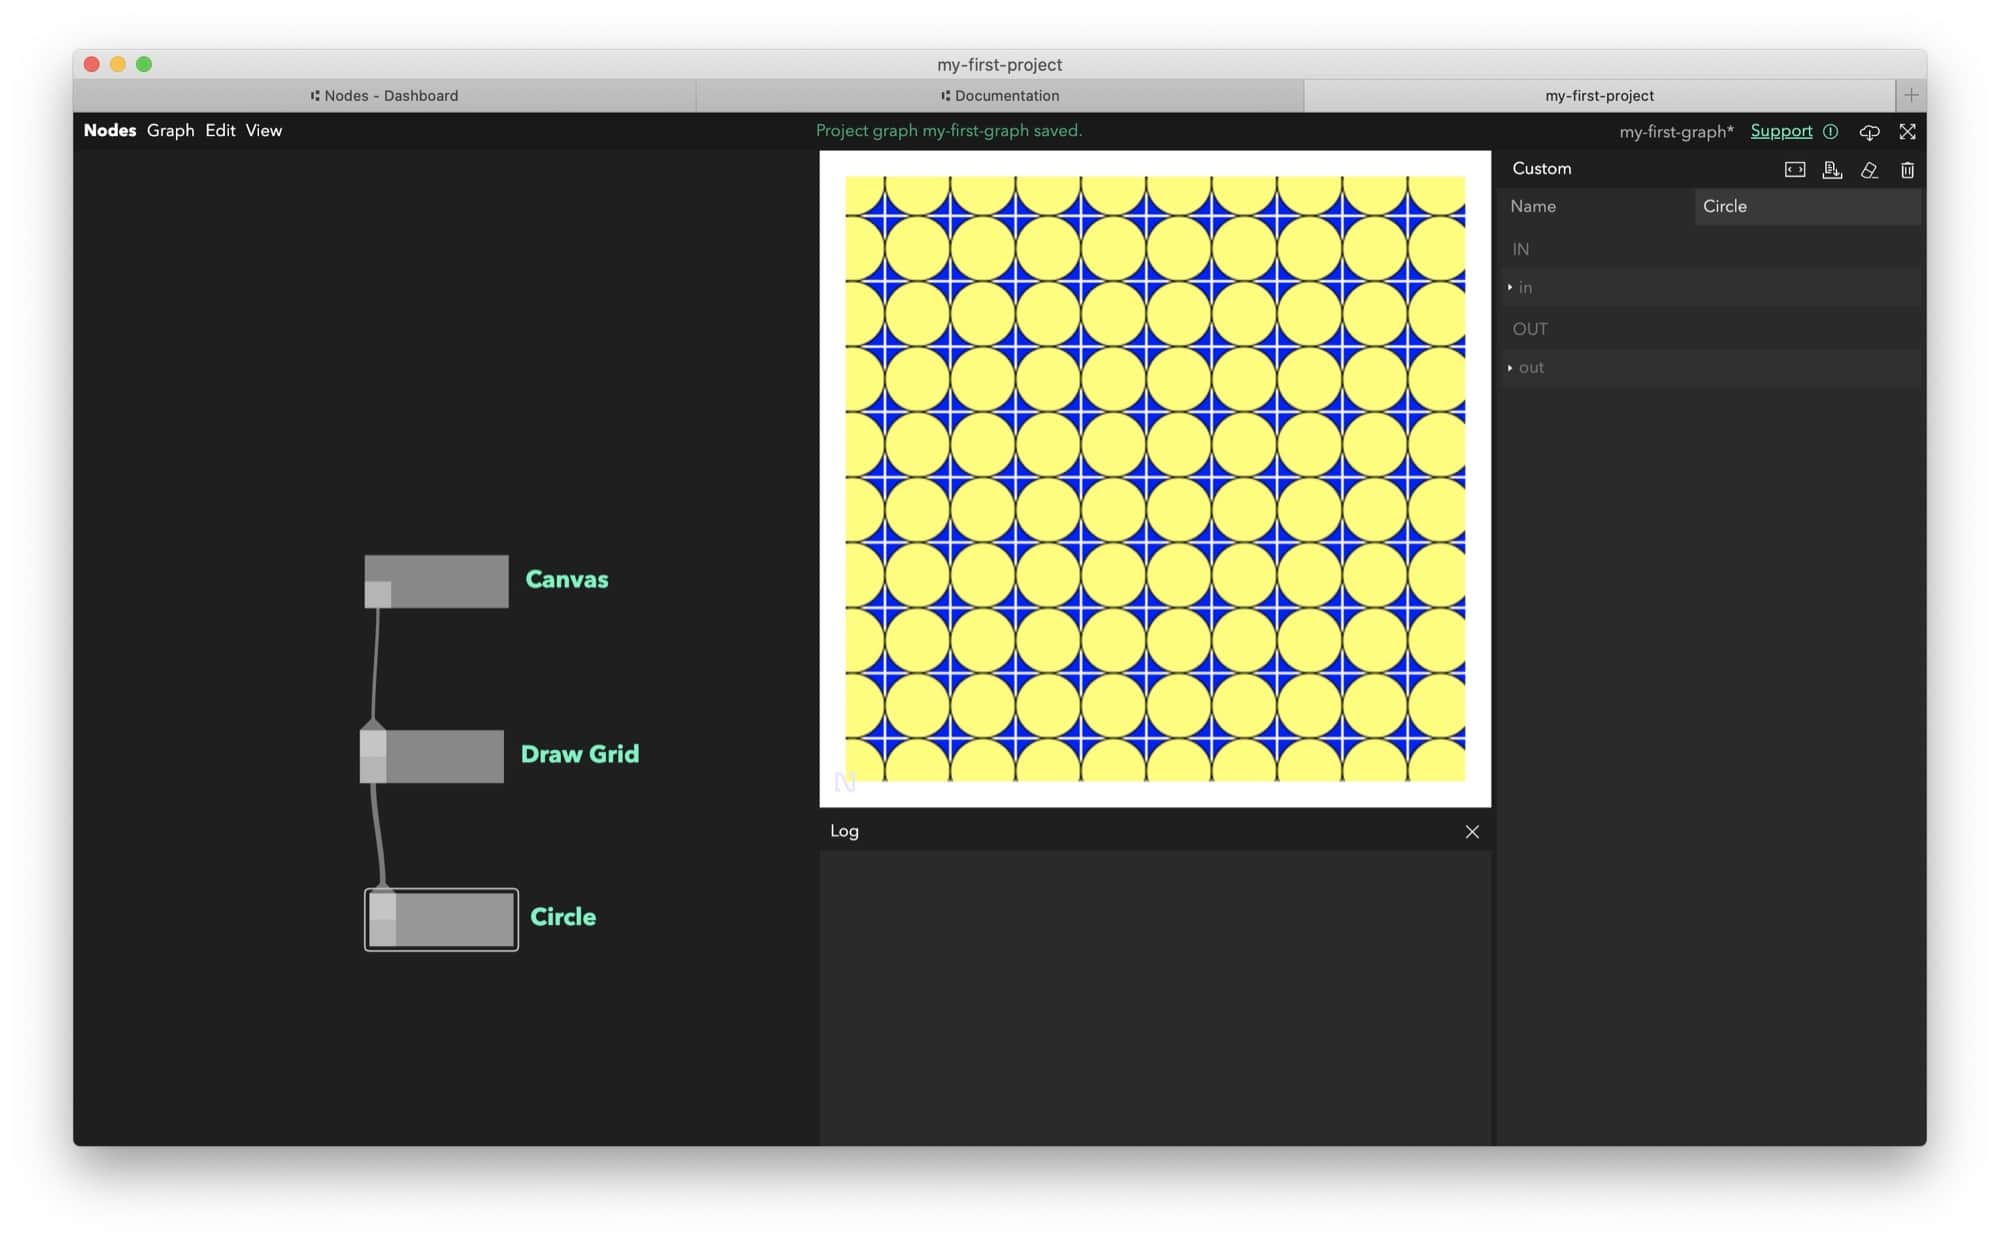
The circle will show up after you connect the new Node to the Draw Grid node out port.
Add more shapes
Create two more nodes the same way you created the Circle node.
Start with Rectangle:
module.exports = (node, graph) => {
	const triggerIn = node.triggerIn("in");

	triggerIn.onTrigger = (props) => {
		const { ctx, size } = props;
		ctx.fillStyle = "#FF0000";
		ctx.strokeStyle = "#000000";
		ctx.beginPath();

		// draw rectangle
		// at position 0,0
		// and width the size of grid
		// and height half the size of grid
		ctx.rect(0, 0, size, size / 2);

		ctx.fill();
		ctx.stroke();
		ctx.closePath();
	};
};
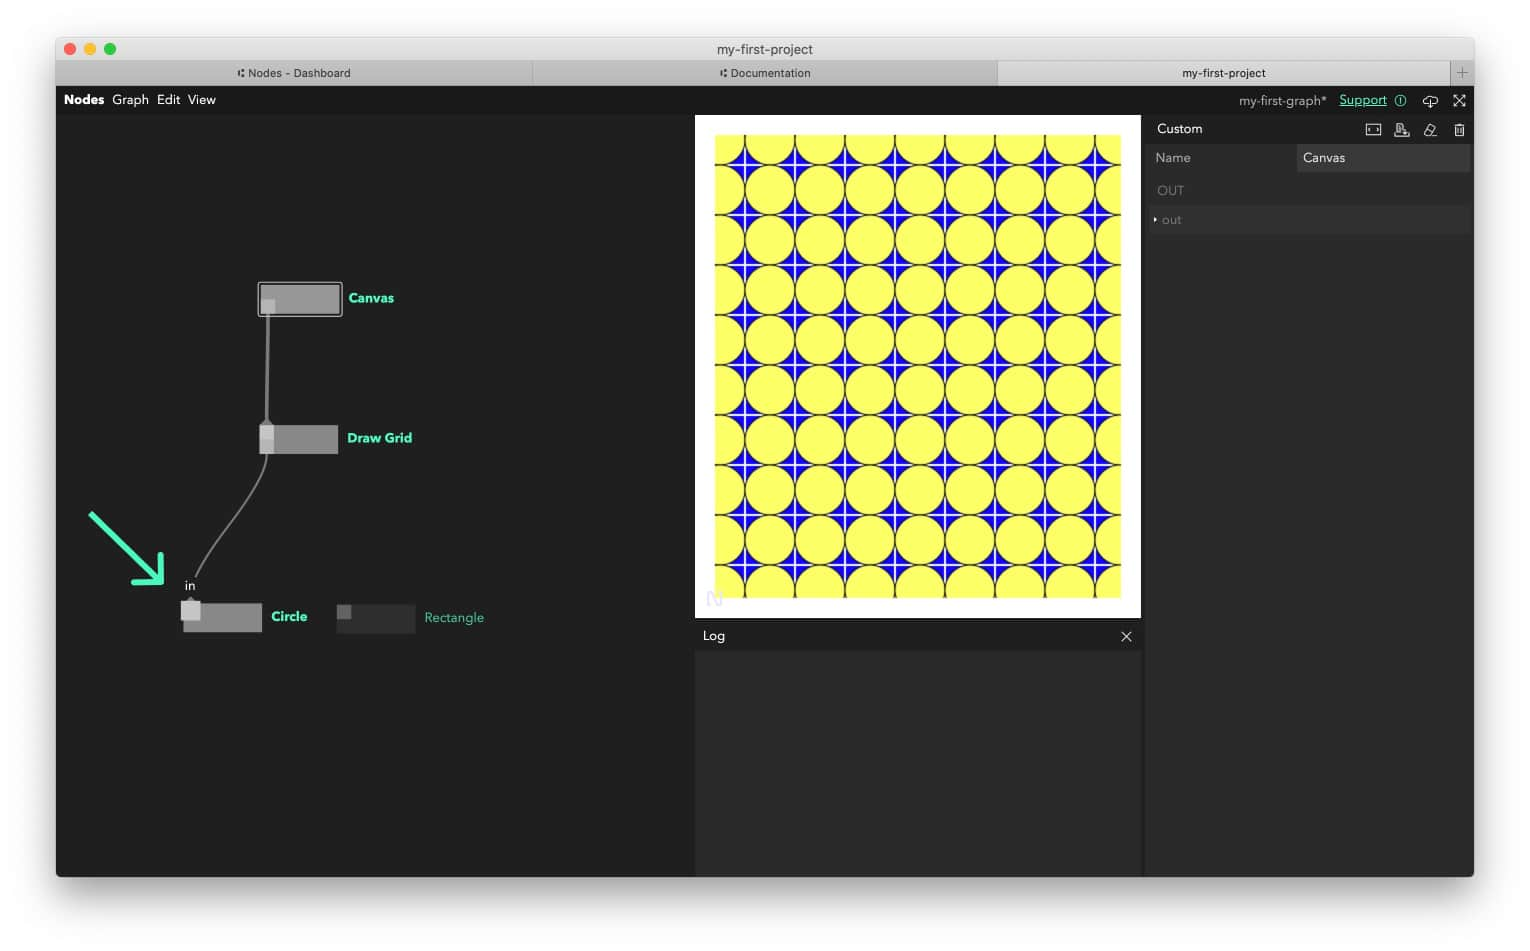
To reconnect from Circle to Rectangle mouse over the Circle in port and, while pressing Shift, click and drag the connection to the Rectangle in port.
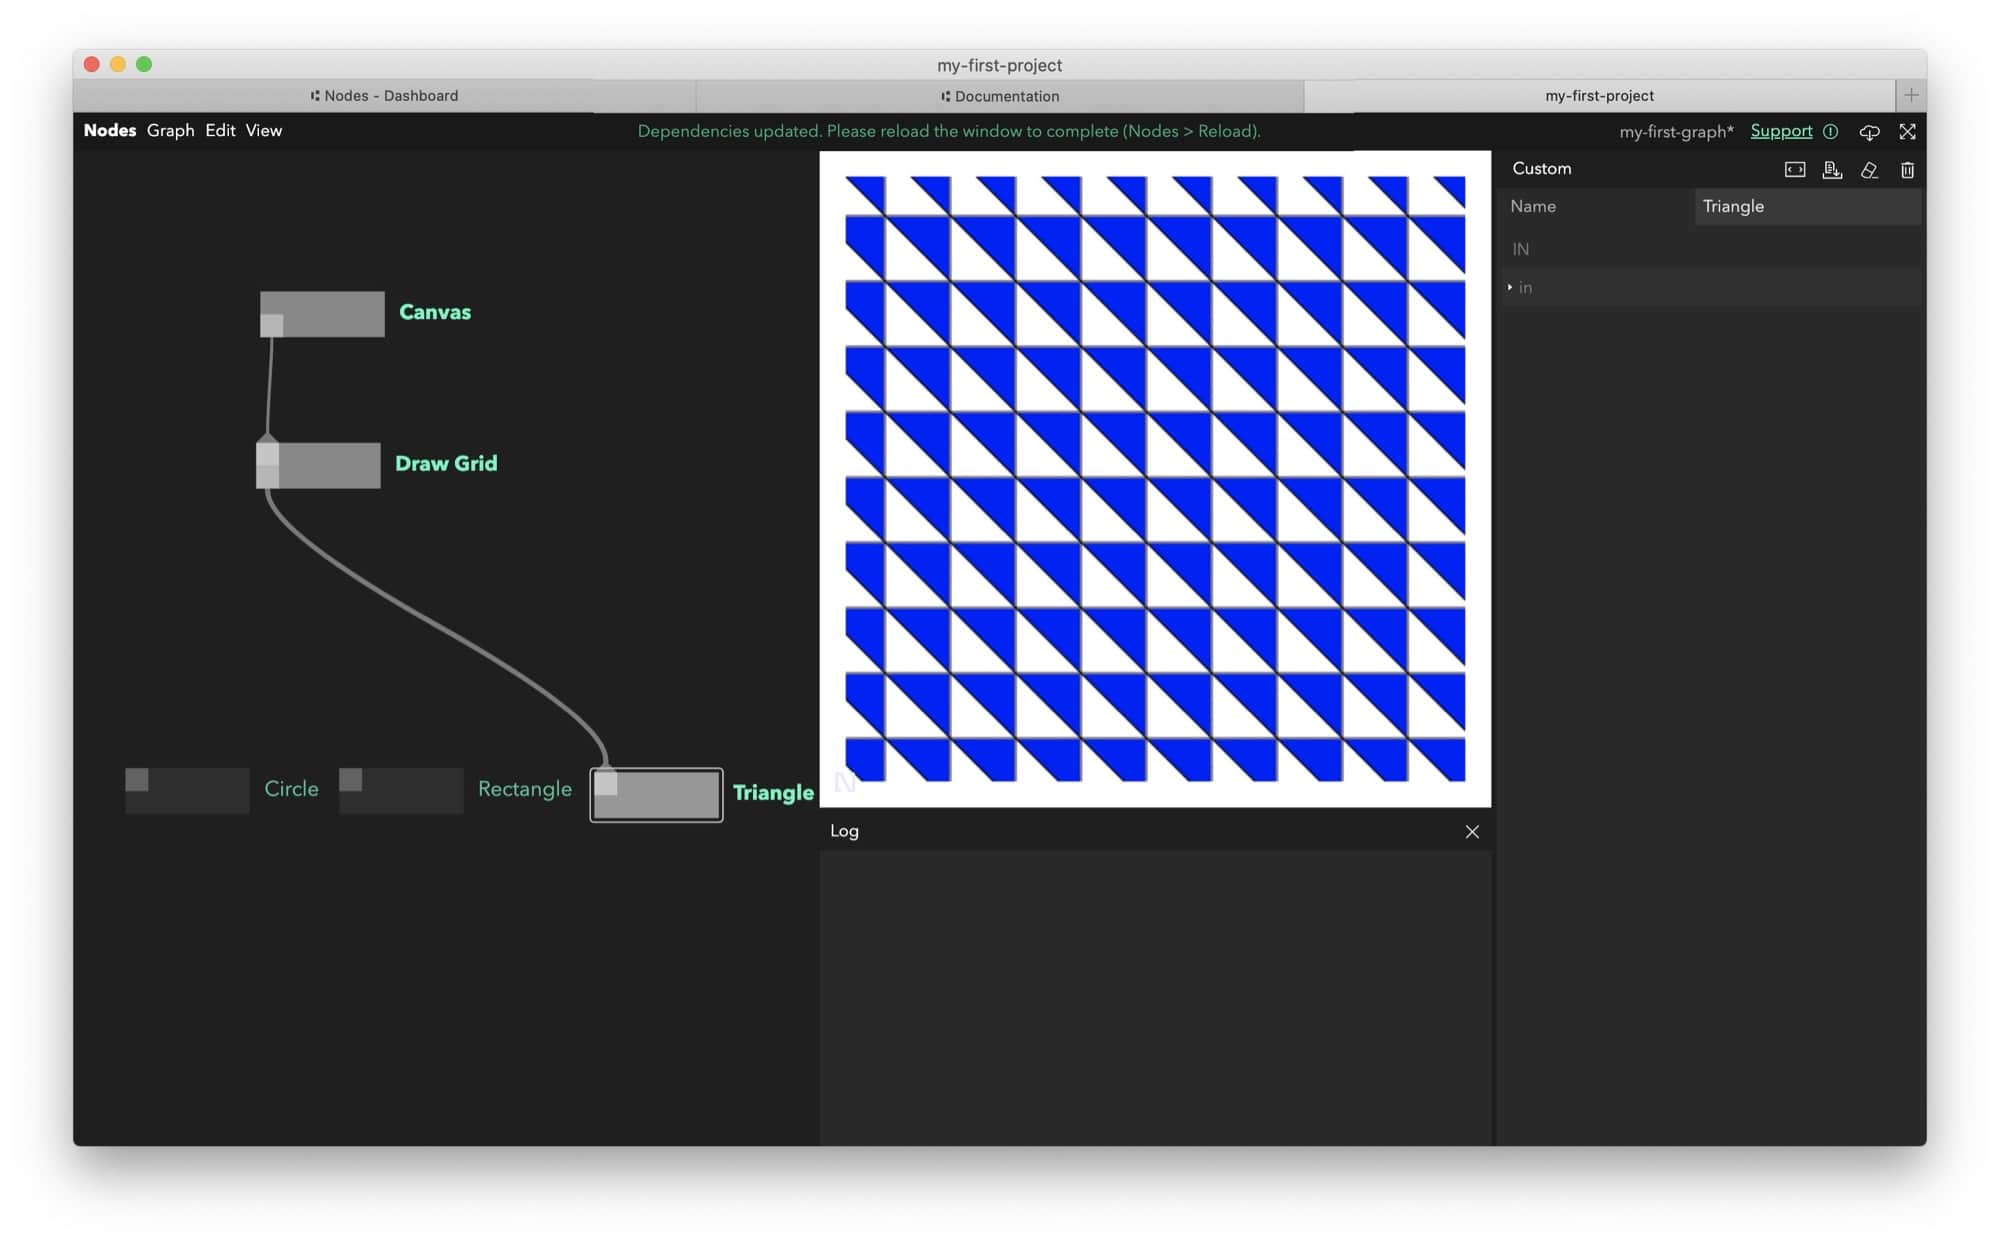
Add Triangle the same way:
module.exports = (node, graph) => {
	const triggerIn = node.triggerIn("in");

	triggerIn.onTrigger = (props) => {
		const { ctx, size } = props;
		ctx.fillStyle = `#FFFFFF`;
		ctx.strokeStyle = "#000000";
		ctx.beginPath();

		// draw triangle
		ctx.moveTo(-size / 2, -size / 2);
		ctx.lineTo(-size / 2, size / 2);
		ctx.lineTo(size / 2, size / 2);

		ctx.closePath();
		ctx.fill();
		ctx.stroke();
		ctx.closePath();
	};
};
Create a shape randomiser
Having the same shape in all the grid cells is a bit boring so let’s randomise things a bit. Nodes can be extended using 3rd party packages from NPM, the JavaScript package manager. To generate random numbers, we’ll use our the package pex-random (developed here at Variable):
- Go to menu Nodes > Packages.
- Click the
Addbutton. - Enter
pex-randomwhere the field withpackage-nameappeared and change the version to1.0.1. - Click the
Savebutton.
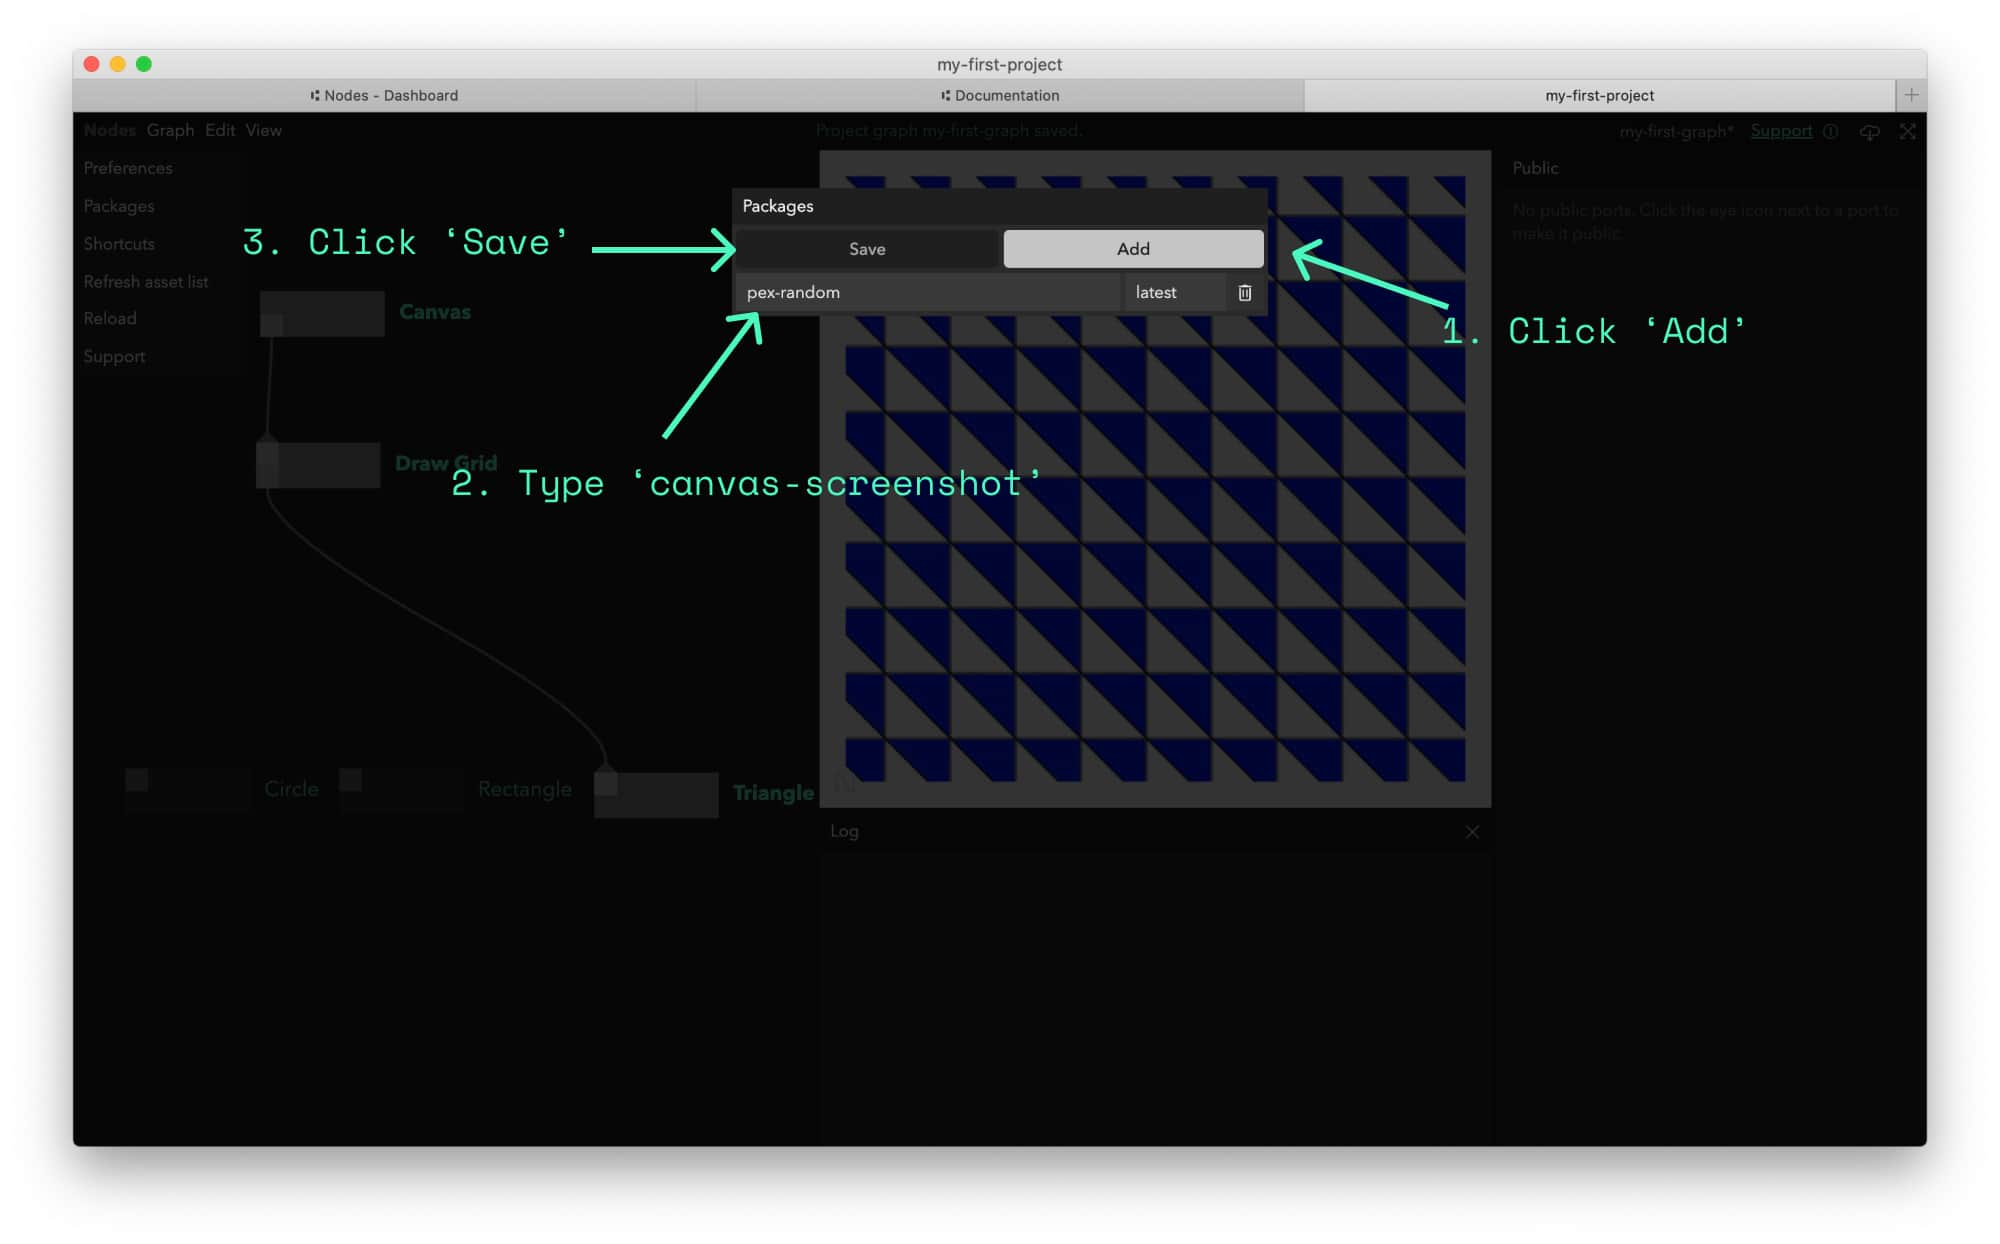
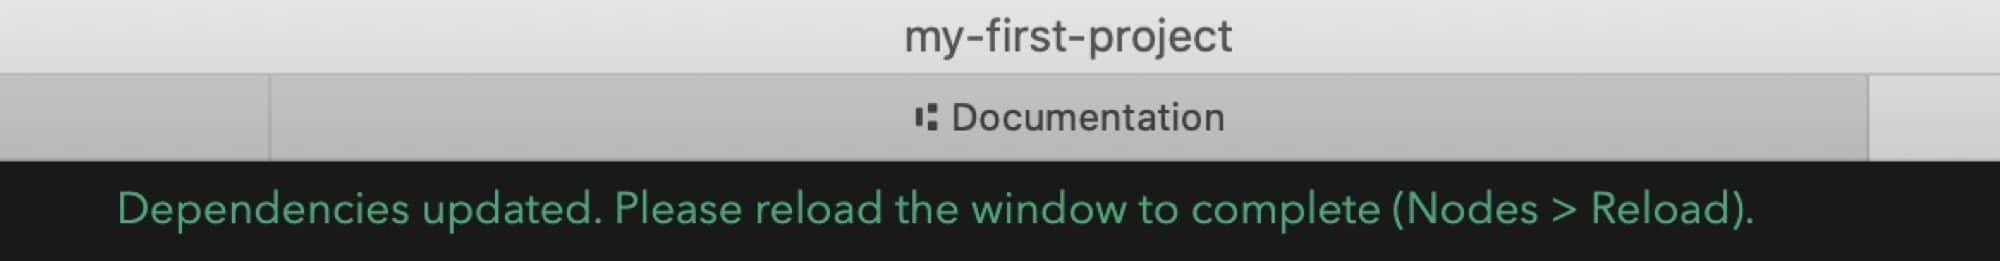
After a moment, a message should appear on top of the window that the installation was completed and asking you to reload the window.
- Press
Cmd/Ctrl+R(or Nodes > Reload in the menu).
- Create a new
Customnode and rename it toRandom Shape.
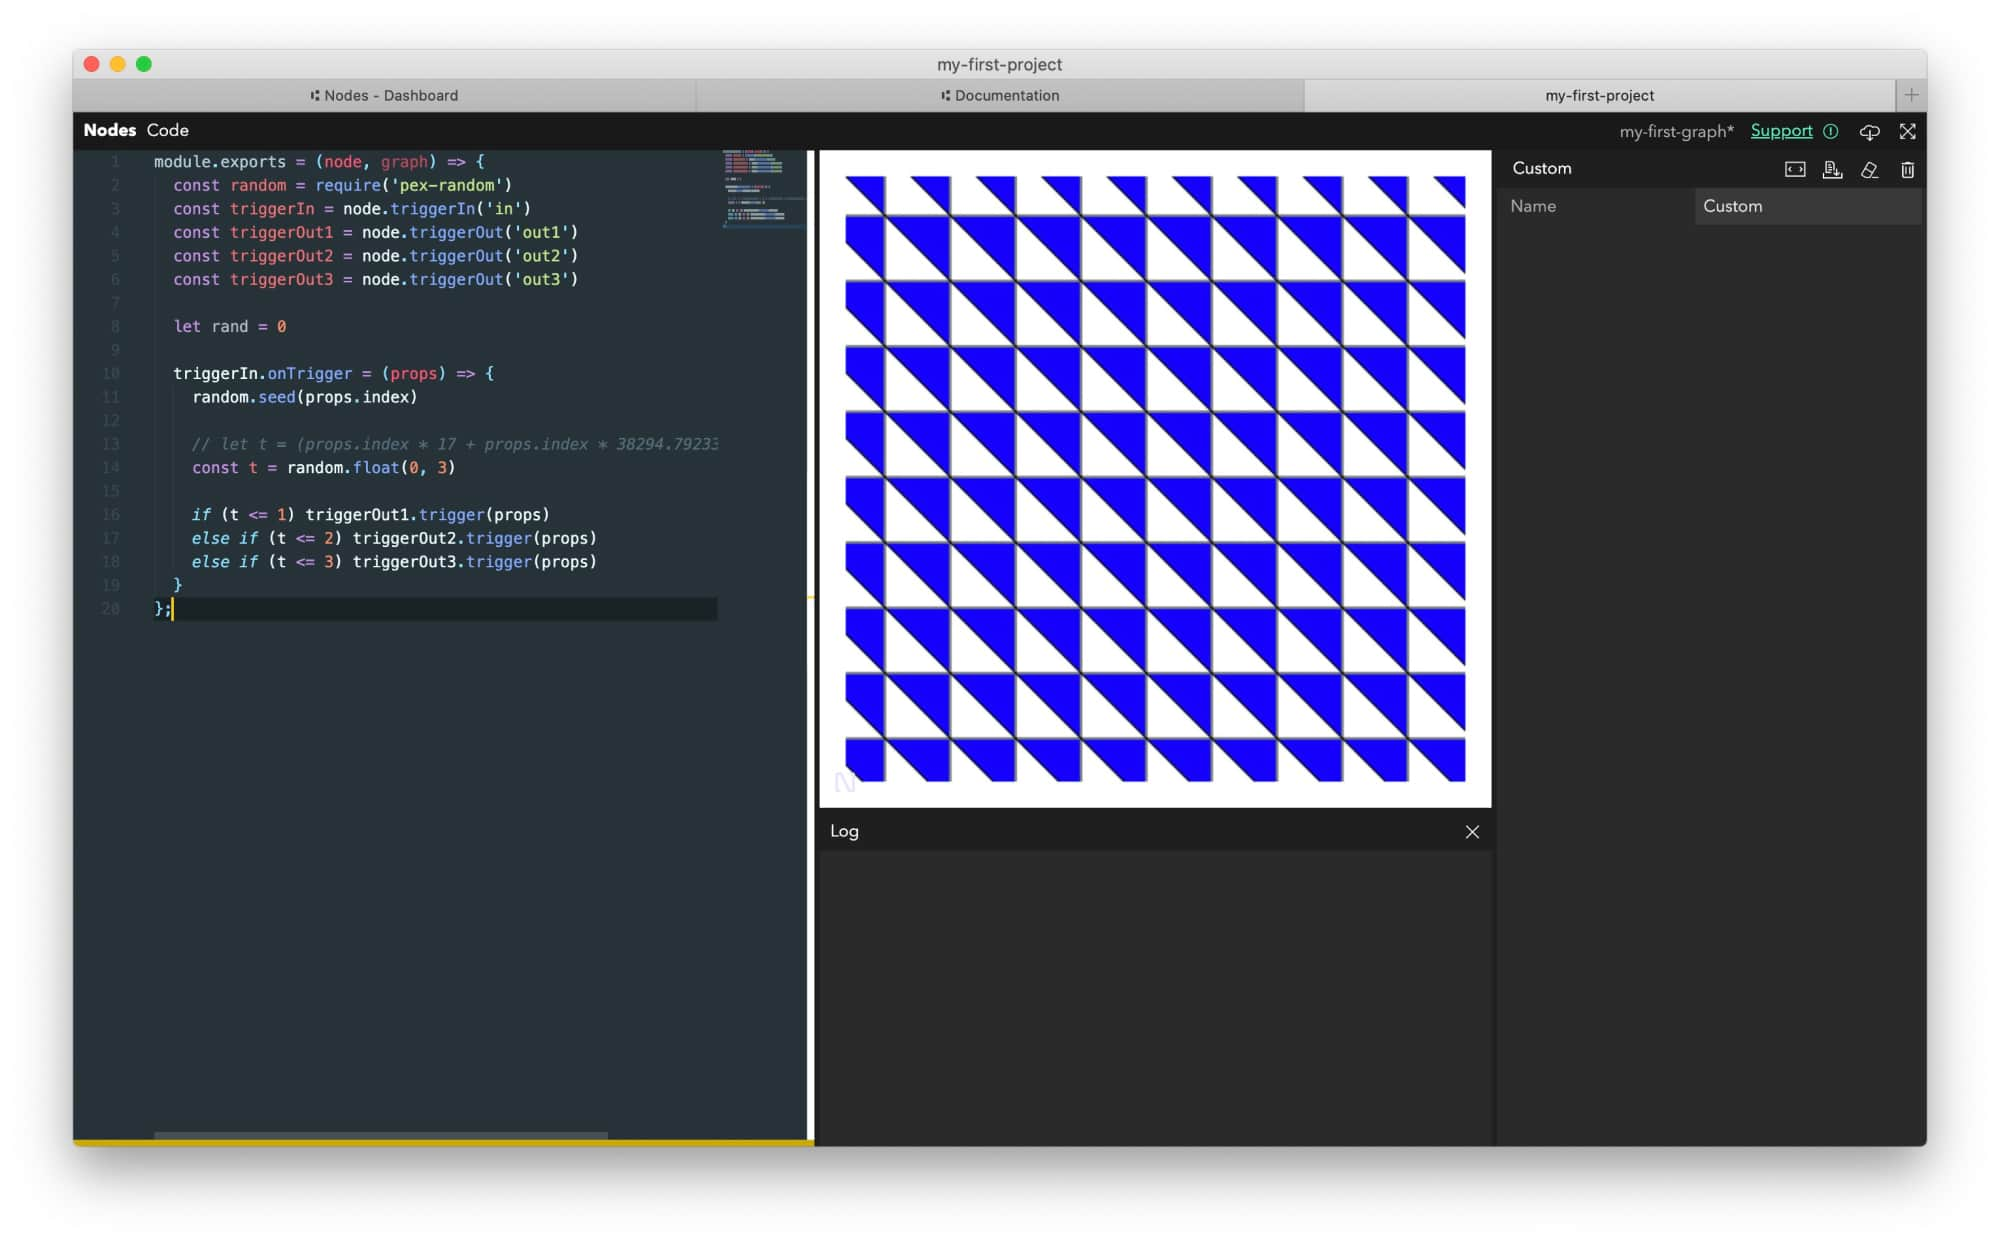
Add the following code to it:
module.exports = (node, graph) => {
	// import pex-random package that we installed
	const random = require("pex-random");

	const triggerIn = node.triggerIn("in");

	// create 3 output triggers
	const triggerOut1 = node.triggerOut("out1");
	const triggerOut2 = node.triggerOut("out2");
	const triggerOut3 = node.triggerOut("out3");

	triggerIn.onTrigger = (props) => {
		// seed random number generator with grid cell index
		// this will create the same number every frame for a given cell
		random.seed(props.index);

		// generate number from 0..2.999
		const t = random.float(0, 3);

		// trigger different output depending on random value
		// this will draw random shapes for each grid cells
		if (t <= 1) triggerOut1.trigger(props);
		else if (t <= 2) triggerOut2.trigger(props);
		else if (t <= 3) triggerOut3.trigger(props);
	};
};
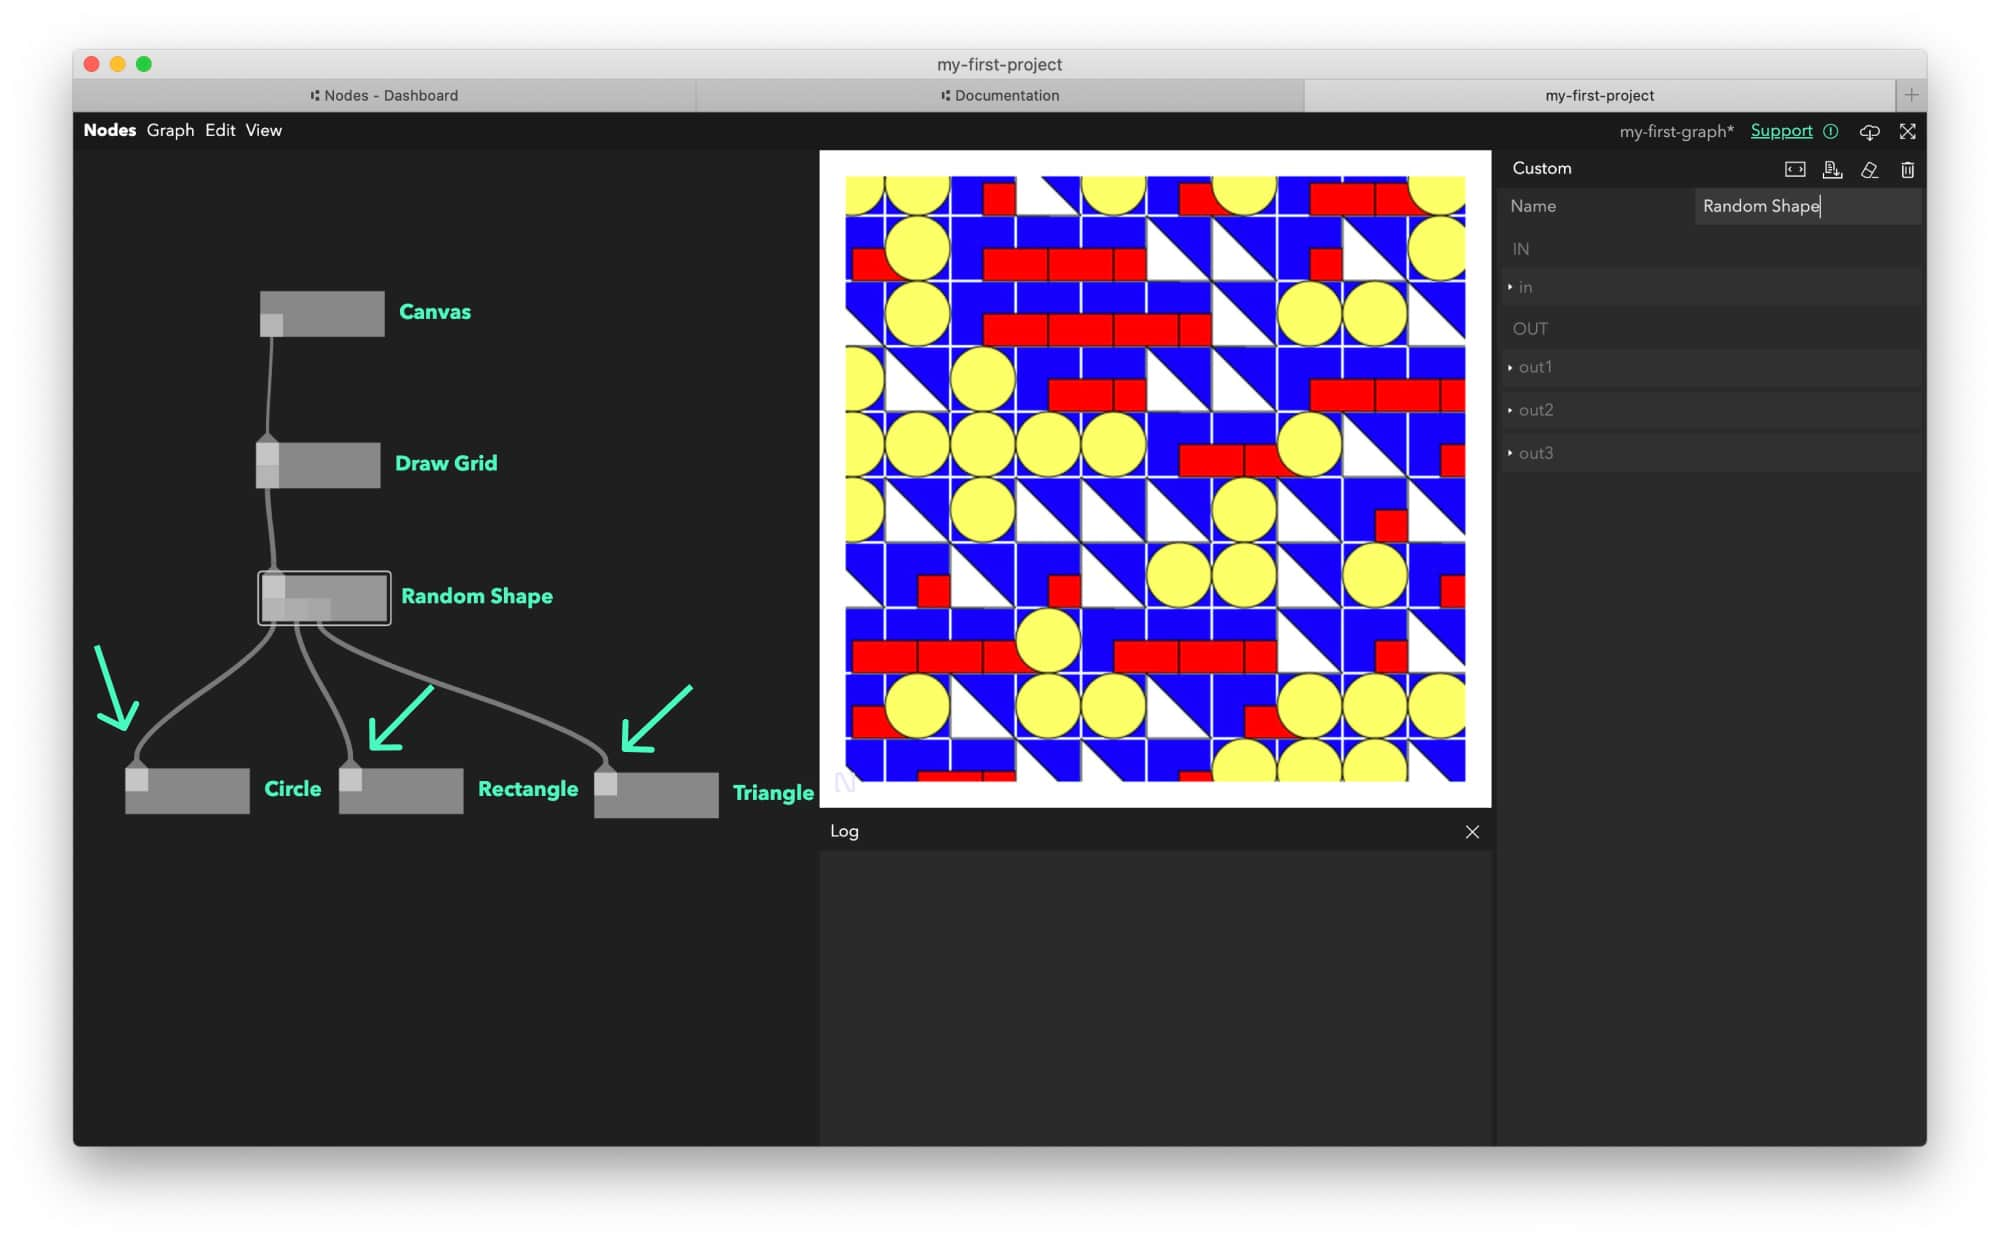
Connect everything as follows:
Draw Gridshould be connected to theRandom Shapeinport.- All shape nodes (
Circle,RectangleandTriangle) should be connected toRandom Shapetrigger out ports (one per port).
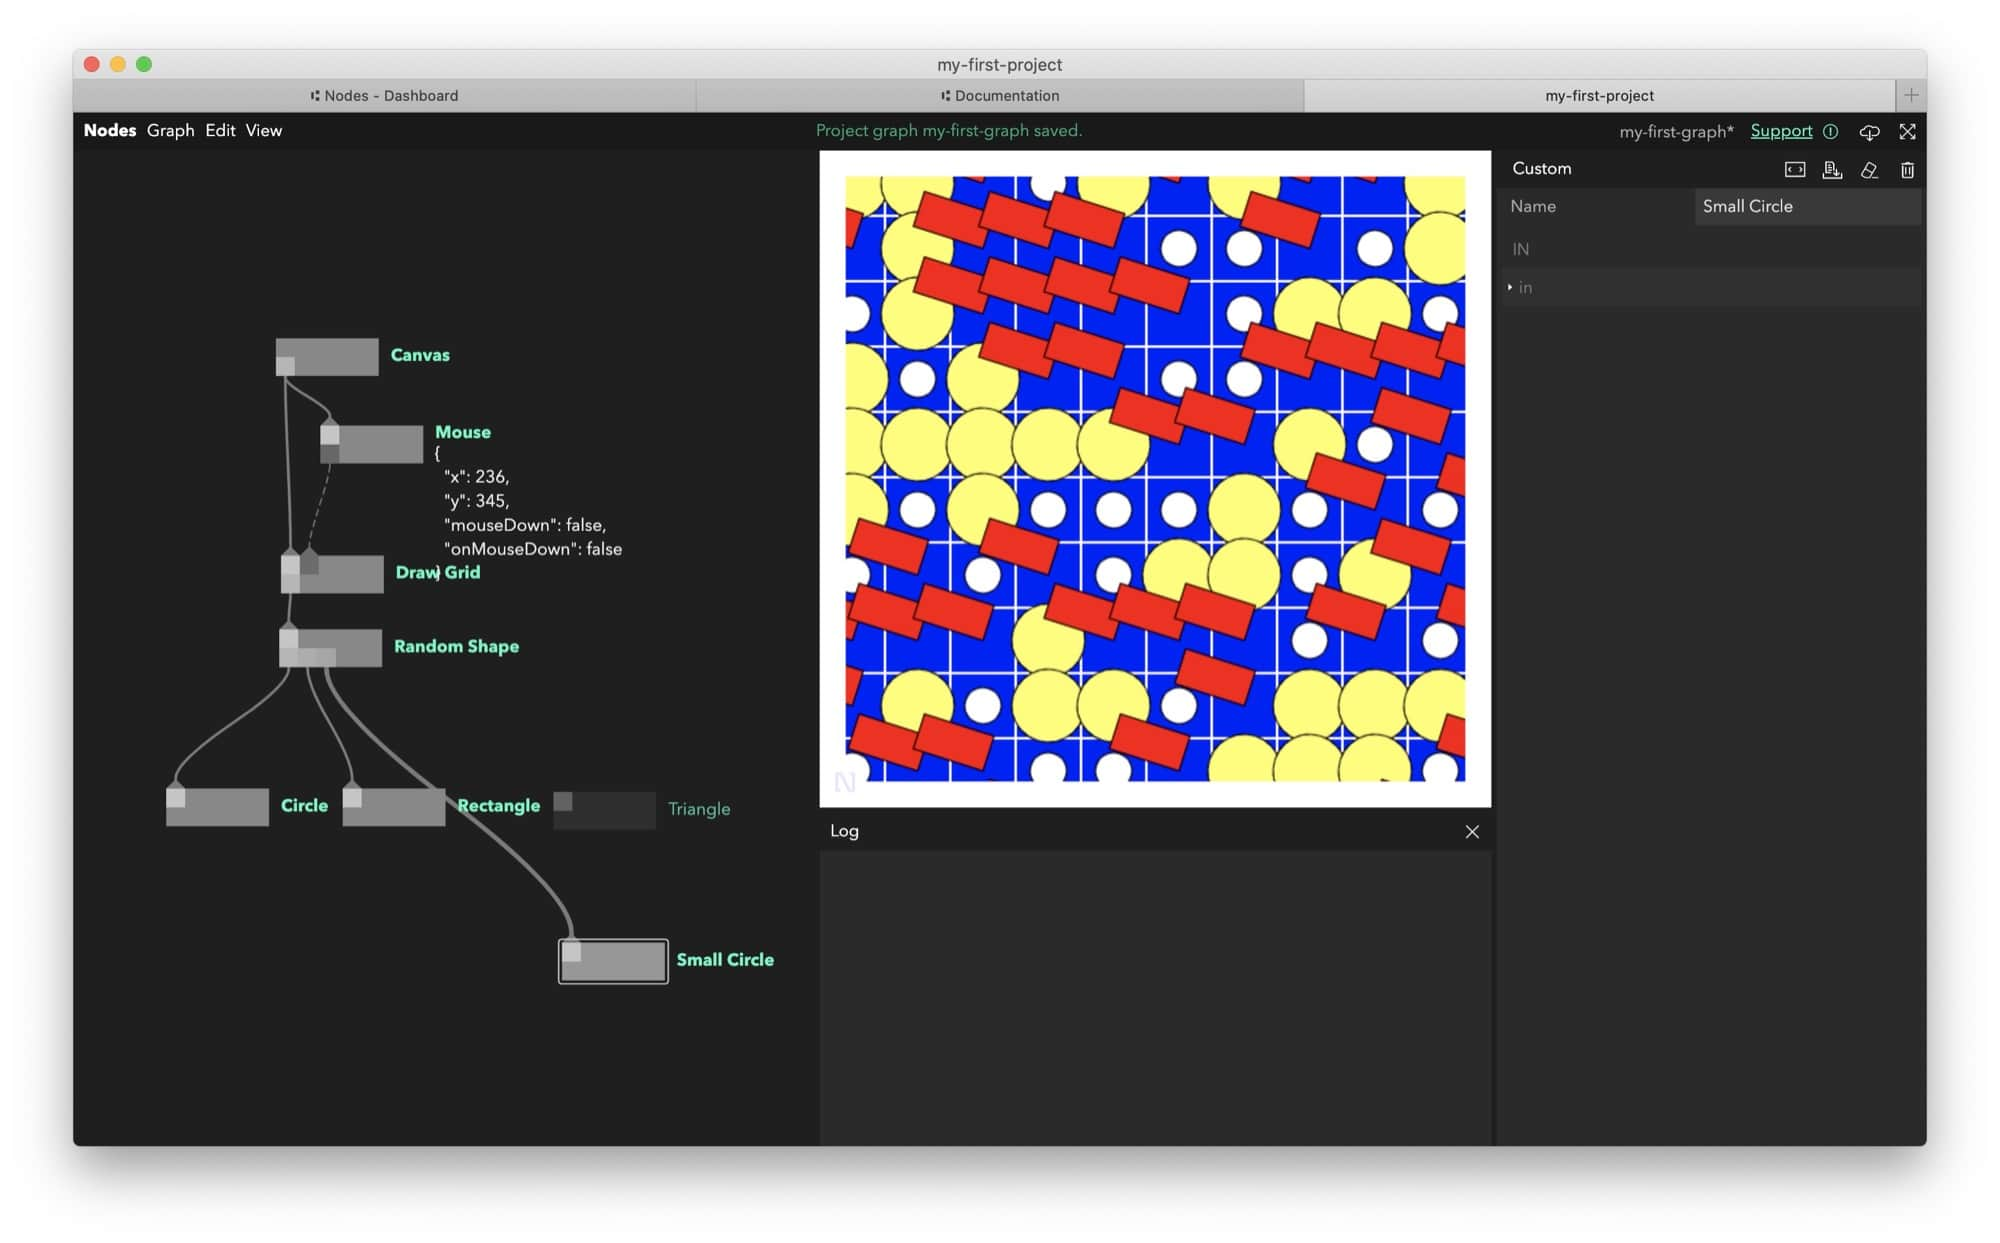
If all went well, you should get a grid of random shapes on the screen:
Add mouse interaction
Let’s get things moving a bit.
- Create a new
Customnode and rename it toMouse:
Add the following code to it:
module.exports = (node, graph) => {
	const triggerIn = node.triggerIn("in");

	// mouse state we will pass to other nodes
	const mouseState = {
		x: 0,
		y: 0,
		mouseDown: false,
	};

	// parameter port we will use to send mouse data
	const mouseOut = node.out("mouse", mouseState);

	const onMouseMove = (e) => {
		mouseState.x = e.layerX;
		mouseState.y = e.layerY;
		mouseOut.setValue(mouseState);

		node.comment = JSON.stringify(mouseState, null, 2);
	};

	const onMouseDown = (e) => {
		mouseState.onMouseDown = true;
		mouseOut.setValue(mouseState);
		node.comment = JSON.stringify(mouseState, null, 2);
	};

	const onMouseUp = (e) => {
		mouseState.onMouseDown = false;
		mouseOut.setValue(mouseState);
	};

	let addedListeners = false;
	let canvas = null;

	// add event listeners on the first run
	triggerIn.onTrigger = (props) => {
		if (!addedListeners) {
			addedListeners = true;
			canvas = props.canvas;
			canvas.addEventListener("mousemove", onMouseMove);
			canvas.addEventListener("mousedown", onMouseDown);
			window.addEventListener("mouseup", onMouseUp);
		}
	};

	// it's important to remove event listeners when destroying node
	node.onDestroy = () => {
		if (canvas) {
			canvas.removeEventListener("mousemove", onMouseMove);
			canvas.removeEventListener("mousedown", onMouseDown);
			window.removeEventListener("mouseup", onMouseUp);
		}
	};
};
- Connect it to
Canvasvia itsoutport (the same wayDraw Gridis connected).

Now let’s upgrade our Draw Grid node with some mouse interaction.
- Open
Draw Gridand add the following line just after thetriggerOutport declarations to create a port.
const mouseIn = node.in("mouse", null);

- Close the editor and connect the new
mouseinport fromDraw Gridto themouseoutport of theMousenode.

- Once connected, open the
Draw Gridnode again and add the following line to retrieve the mouse position in thetriggerIn.onTriggercallback.
const mouseState = mouseIn.value;
- In the second for loop – the one drawing the shapes - add a context rotation right after the translation and pass down the size property relative to the mouse position in the
triggerOut.triggerobject.
// ...
// rotate the shapes based on mouse y position
ctx.rotate(mouseState.y / 100);

// trigger output port effectively drawing child nodes
// with additional `size` and `index` properties
triggerOut.trigger({
	...props,
	index,
	size: step * 0.2 + (mouseState.x / canvas.width) * 100,
});
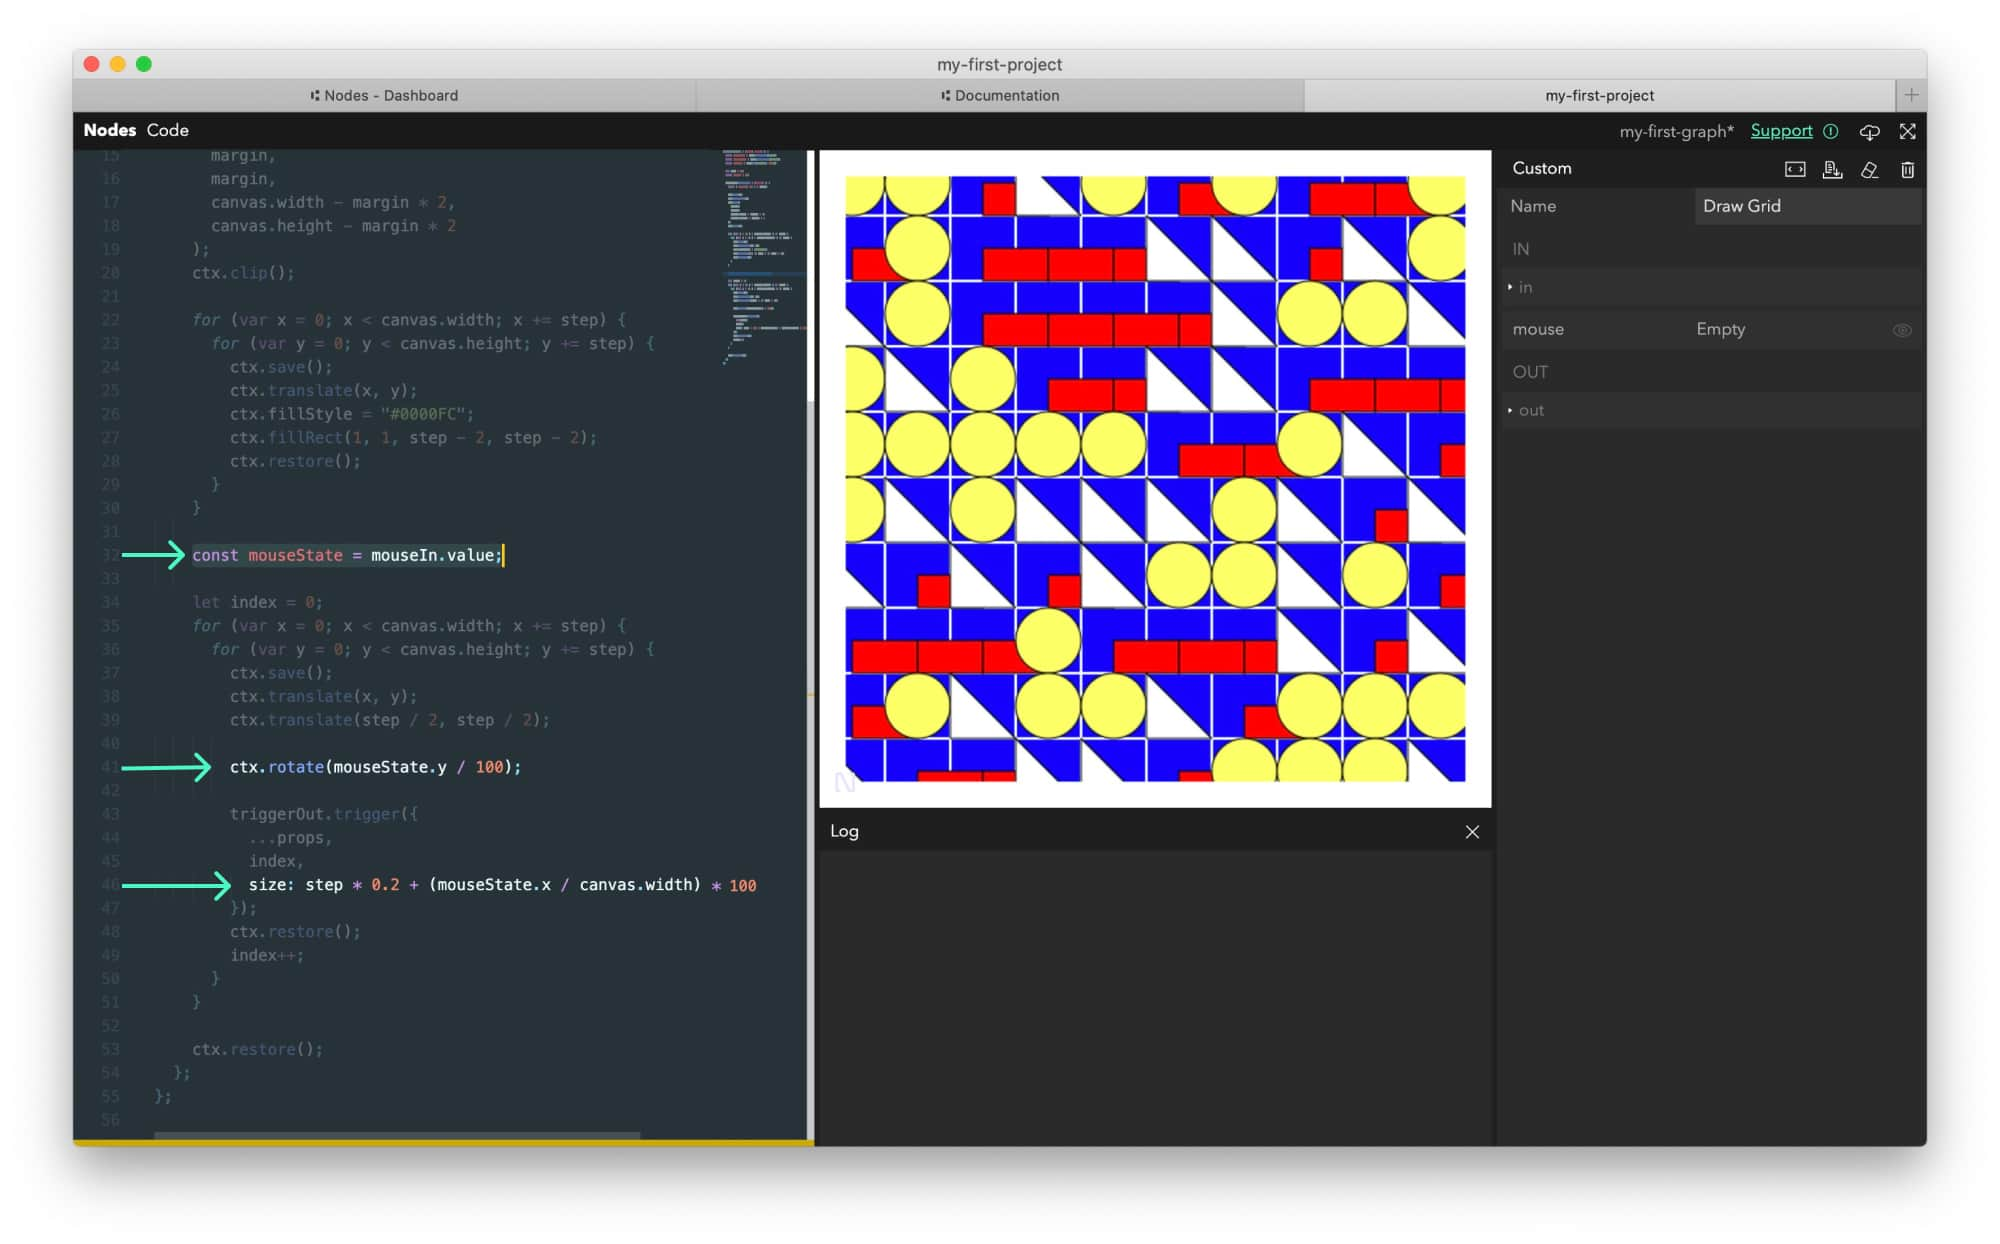
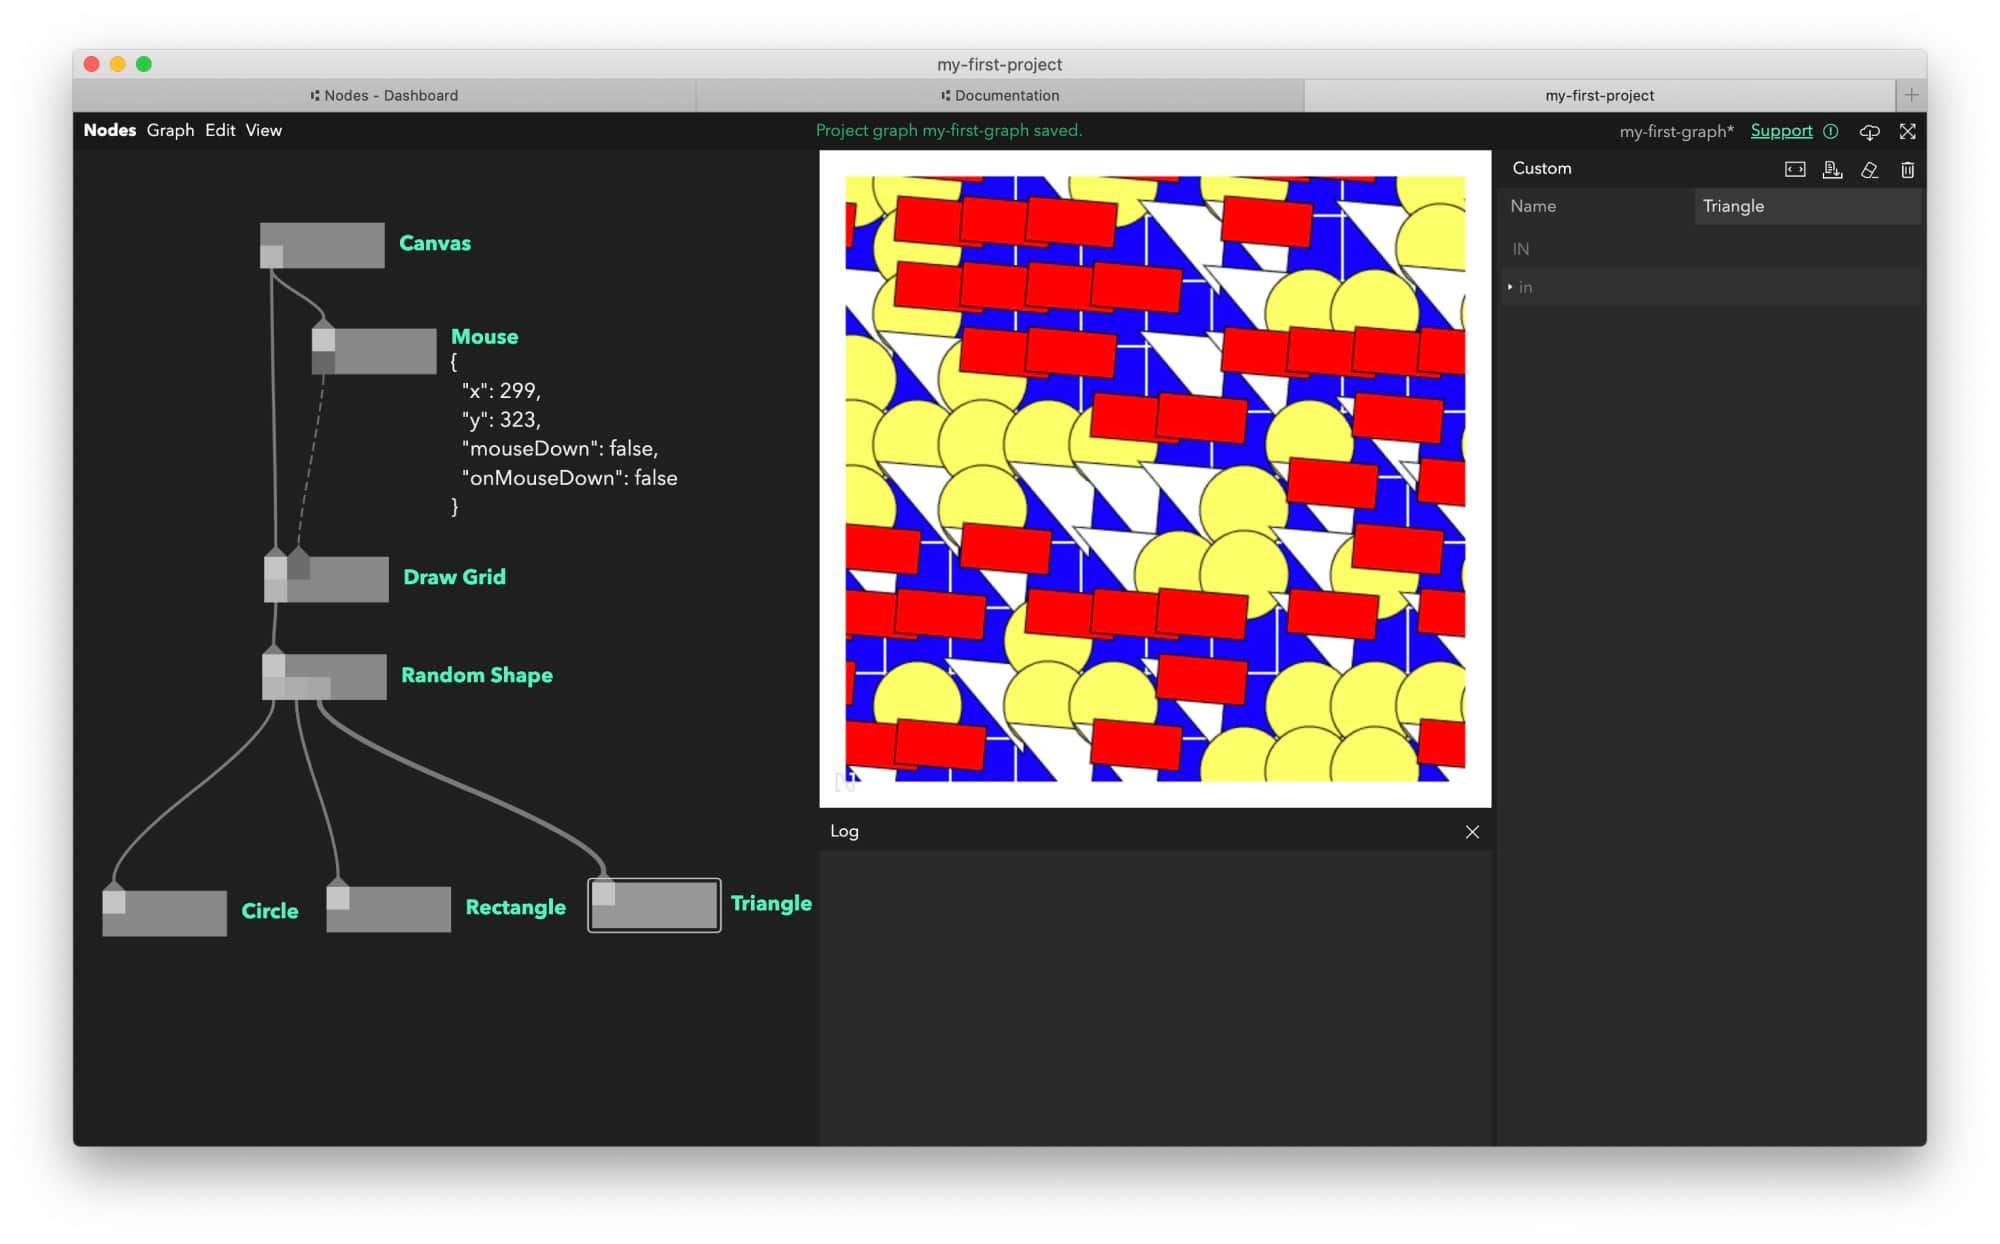
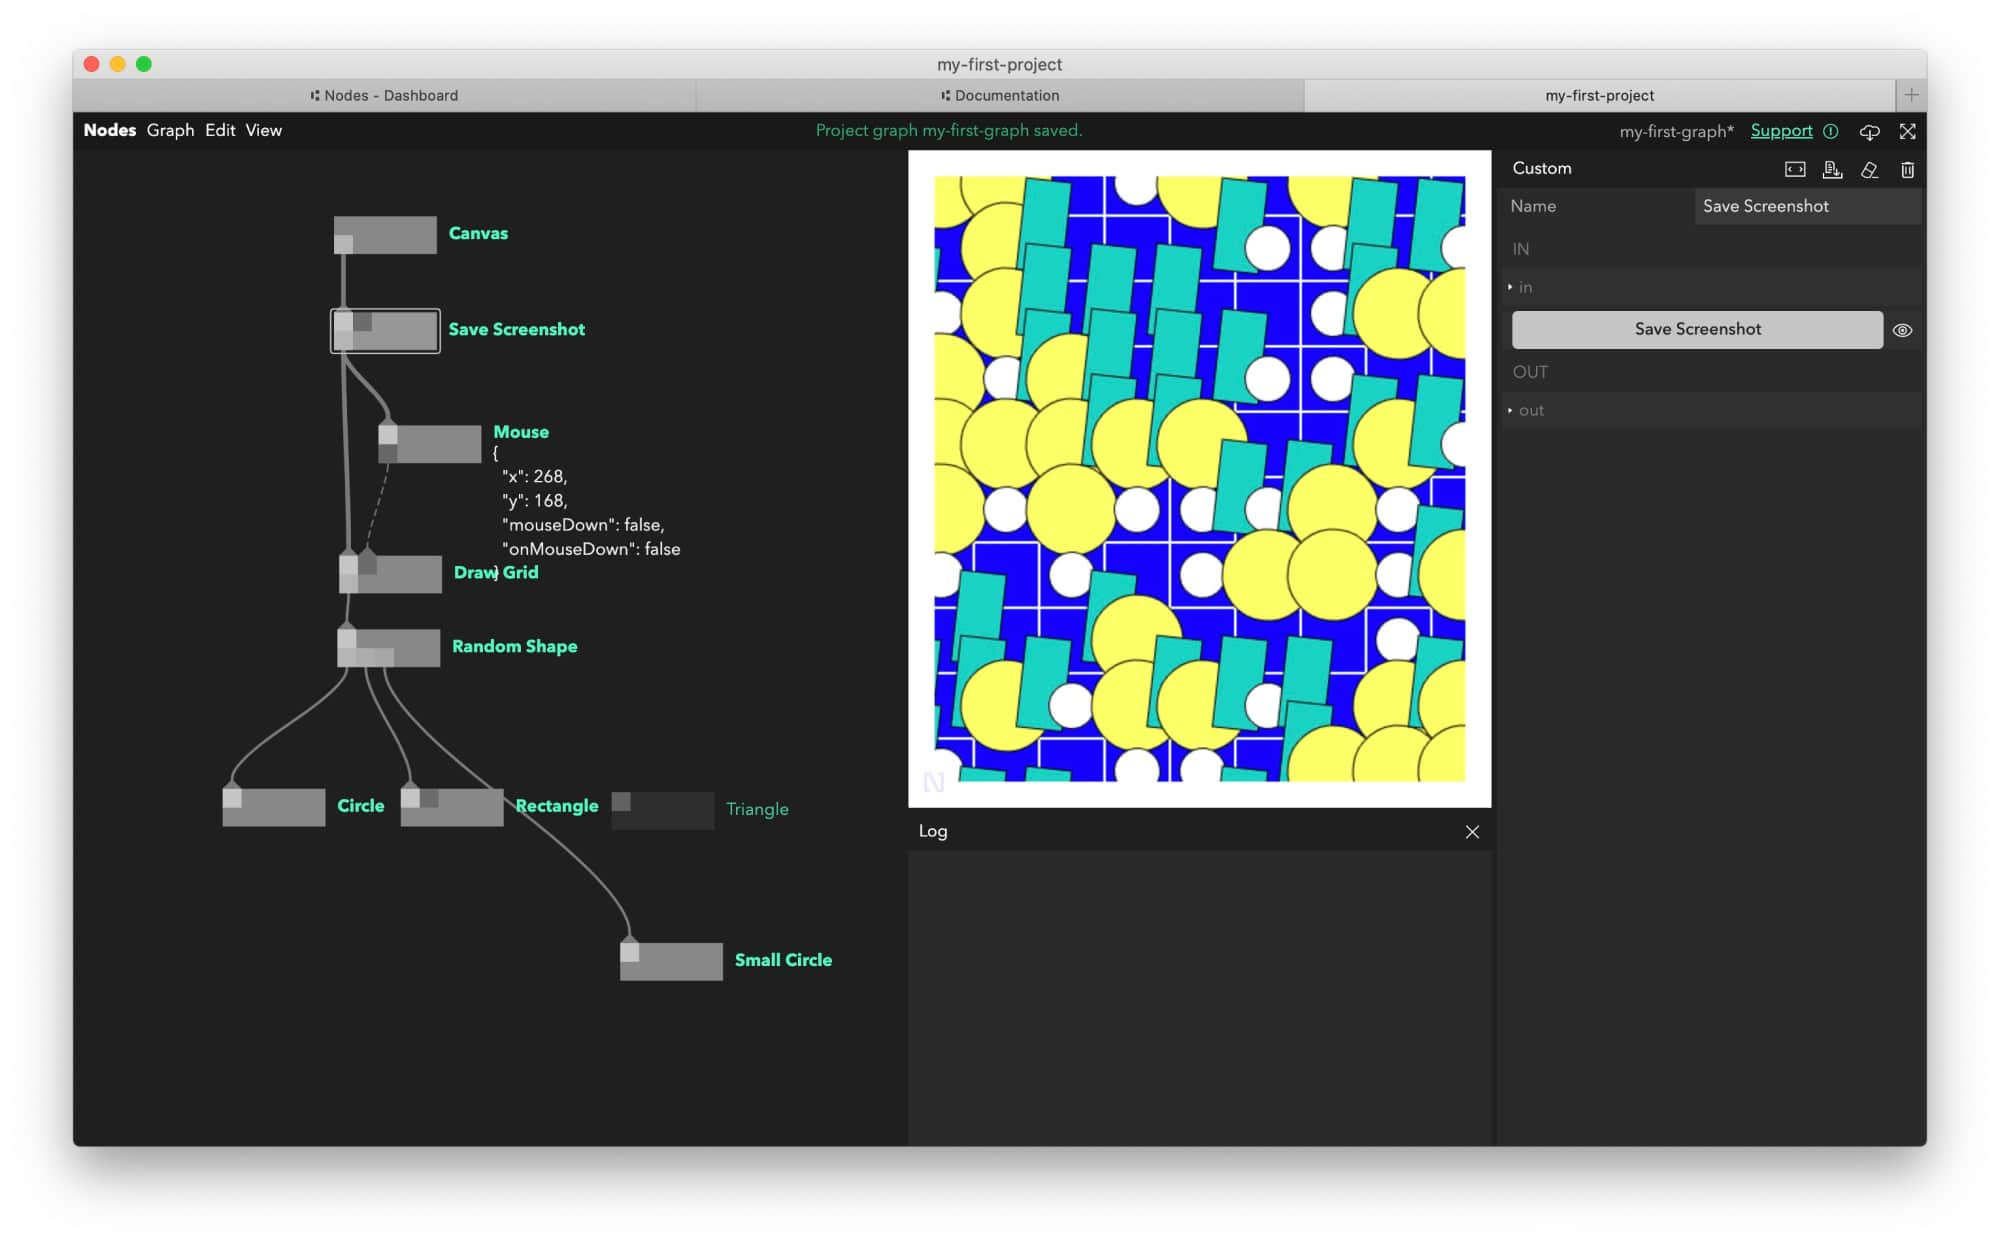
The grid should now respond to mouse movements over the Scene. Shapes will change size and rotate based on mouse movement.
Extra: Add more shapes
To achieve the same look as in the interactive demo at the top of this page, let’s add more shapes.
- Create a new
Customnode and rename it toSmall Circle:
Add the following code to it:
module.exports = (node, graph) => {
	const triggerIn = node.triggerIn("in");

	triggerIn.onTrigger = (props) => {
		const { ctx, size } = props;
		ctx.fillStyle = `#FFFFFF`;
		ctx.strokeStyle = "#000000";
		ctx.beginPath();
		ctx.ellipse(0, 0, size / 4, size / 4, 0, 0, Math.PI * 2);
		ctx.fill();
		ctx.stroke();
		ctx.closePath();
	};
};
You can now disconnect the Triangle node from the Random Shape node by holding the Shift key, left clicking on the input port of the Small Circle node, dragging the connection off and releasing left click. You can now connect the Small Circle node into the final port of the Random Shape node which you just removed.
Extra: Customize colors
It’s time to add some parameters to our graph to customise the look.
We will start by installing a new module called pex-color for parsing colours and converting them in different formats.
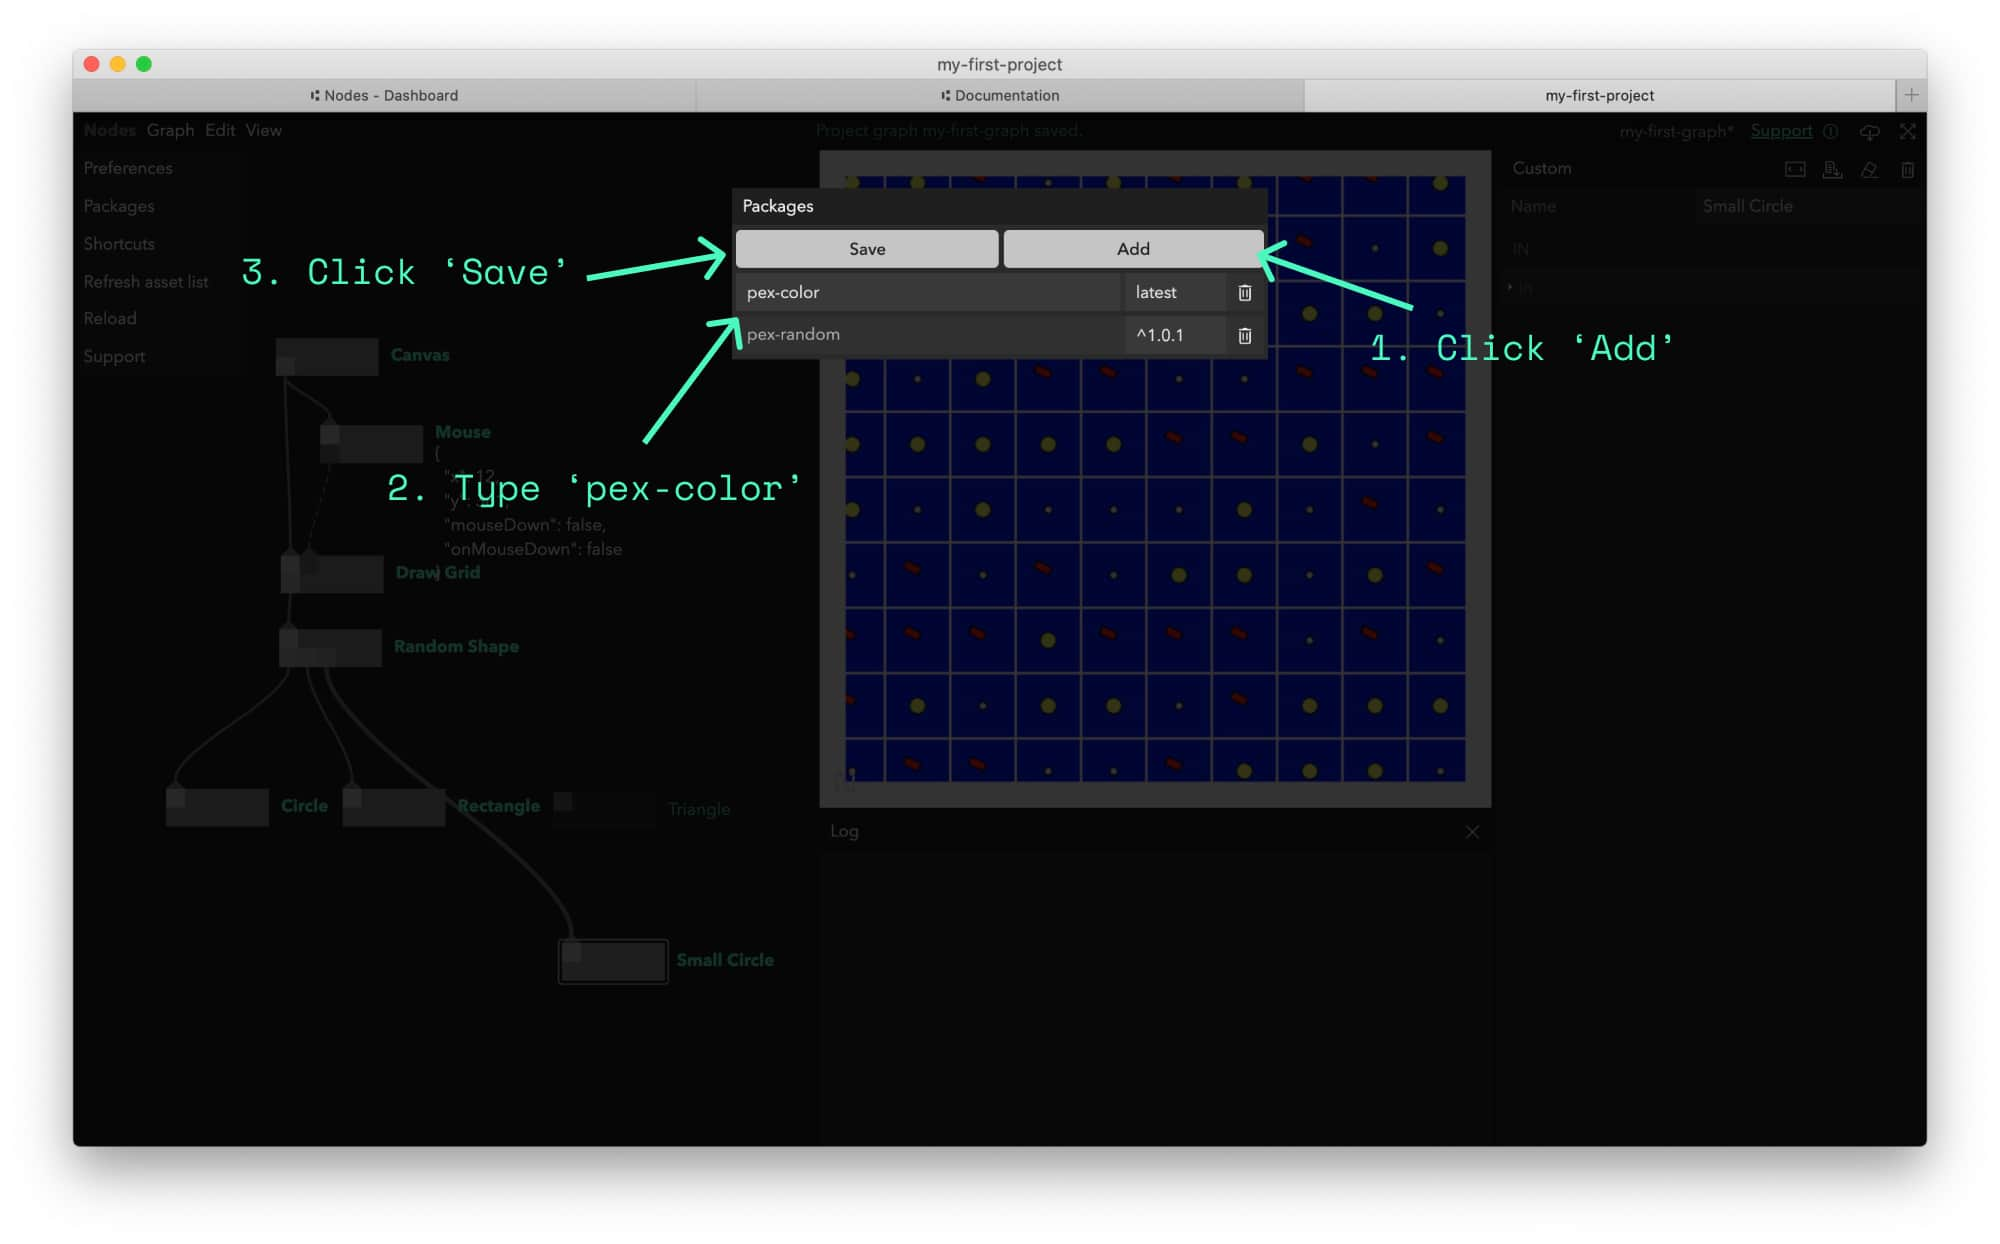
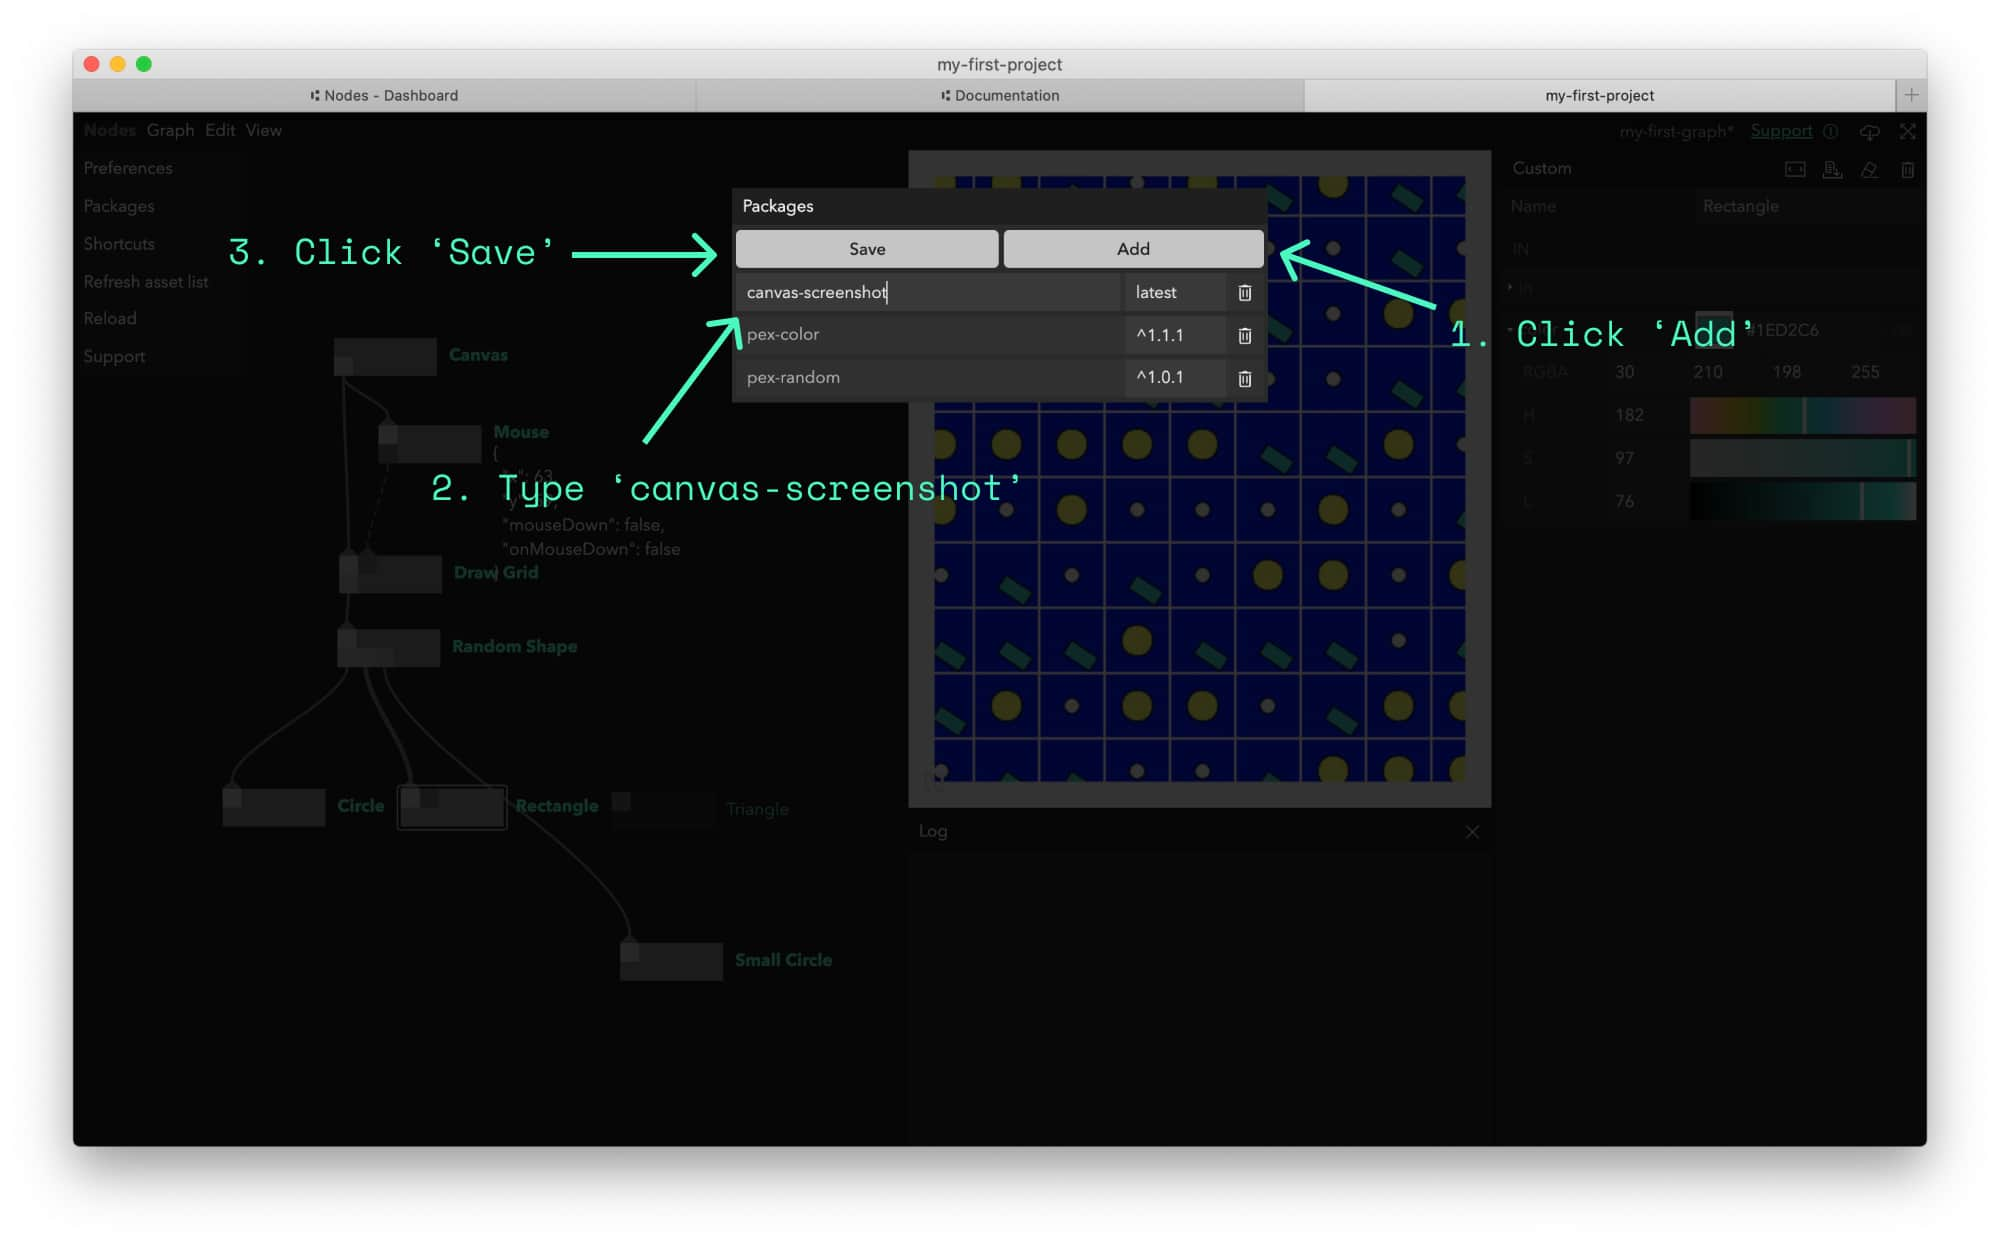
- Go to menu Nodes > Packages.
- Click the
Addbutton - Type
pex-color, change the version to1.1.1and then save.
After the package has been installed save your project with Cmd/Ctrl+S and reload the graph via Cmd/Ctrl+R (or Nodes > Reload in the menu).
Let’s add a parameter to the Rectangle node. Color parameters in Nodes use [r, g, b, a] format where all values are from 0…1. HTML Canvas uses hexadecimal numbers for colours so we need to convert between the two. This is where the getHex function from pex-color package comes into play.
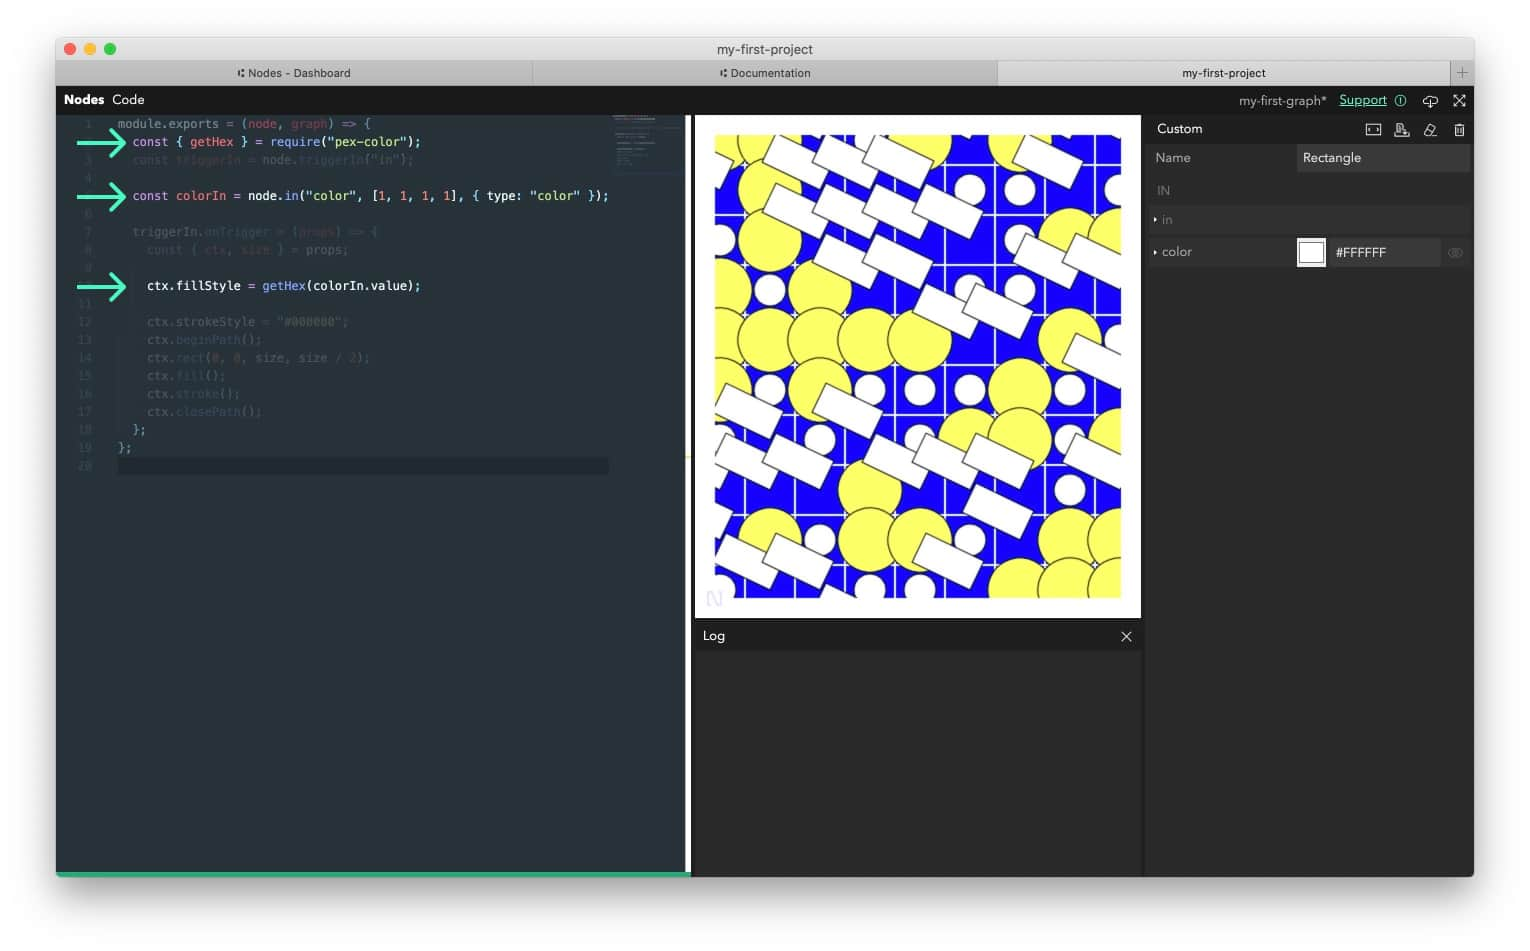
module.exports = (node, graph) => {
	// import getHex function pex-color package
	const { getHex } = require("pex-color");
	const triggerIn = node.triggerIn("in");

	//Add a 4 dimensional color input [r,g,b,a]
	//Adding the {type: "color"} parameter creates the color picker in the inspector
	const colorIn = node.in("color", [1, 1, 1, 1], { type: "color" });

	triggerIn.onTrigger = (props) => {
		const { ctx, size } = props;

		//convert [r, g, b, a] to hex #RRGGBB color
		ctx.fillStyle = getHex(colorIn.value);

		ctx.strokeStyle = "#000000";
		ctx.beginPath();
		ctx.rect(0, 0, size, size / 2);
		ctx.fill();
		ctx.stroke();
		ctx.closePath();
	};
};
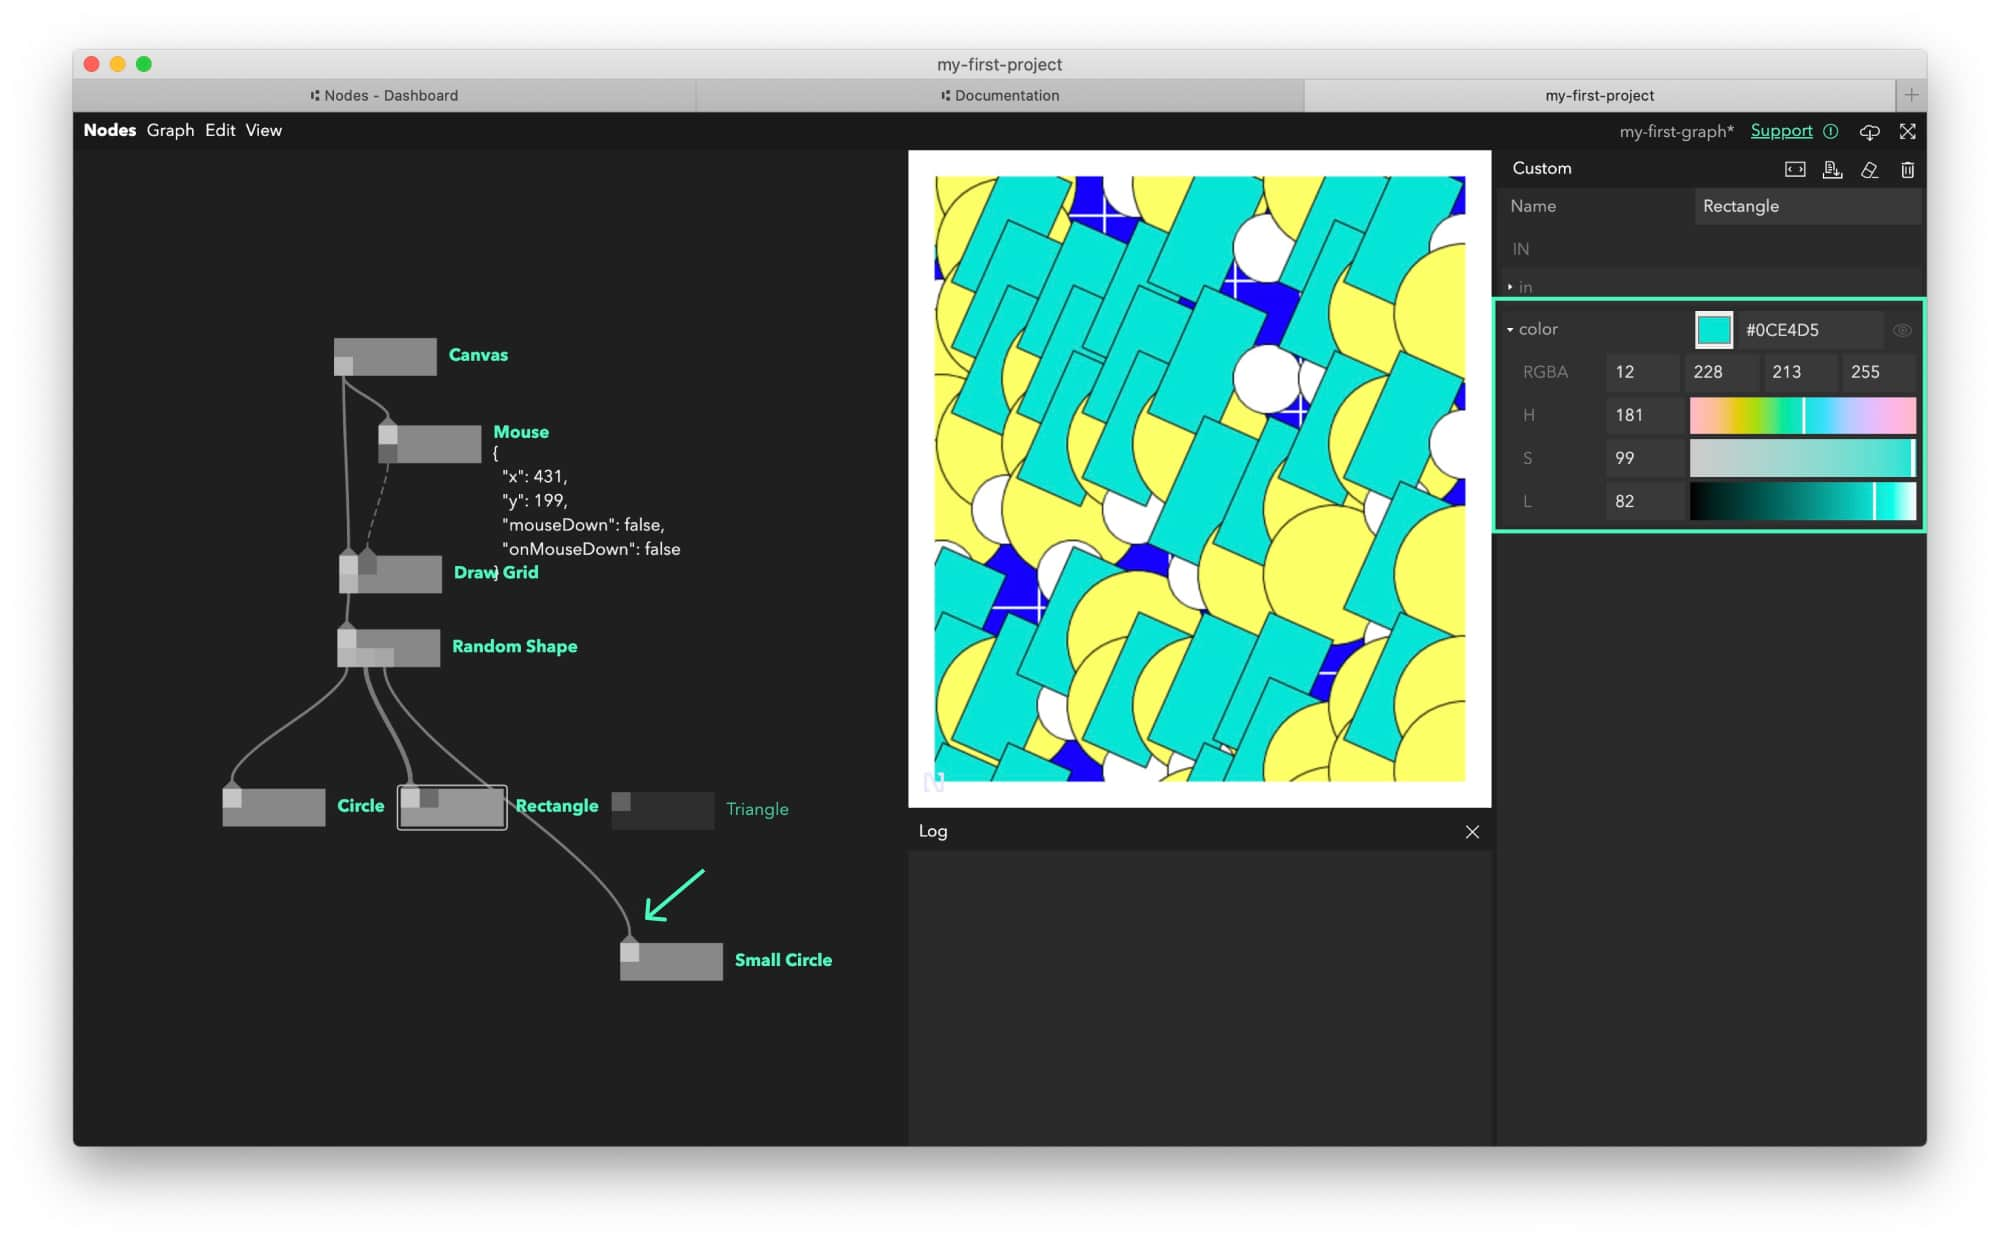
After your recompile the code, you should see a colour input in the Inspector. Click on the coloured square to bring up a colour picker or expand the port with the arrow next to the name to show hsl sliders and rgba values.
Extra: Export as an image
To save our canvas as png images, we will use the canvas-screenshot package (version 3.0.0):
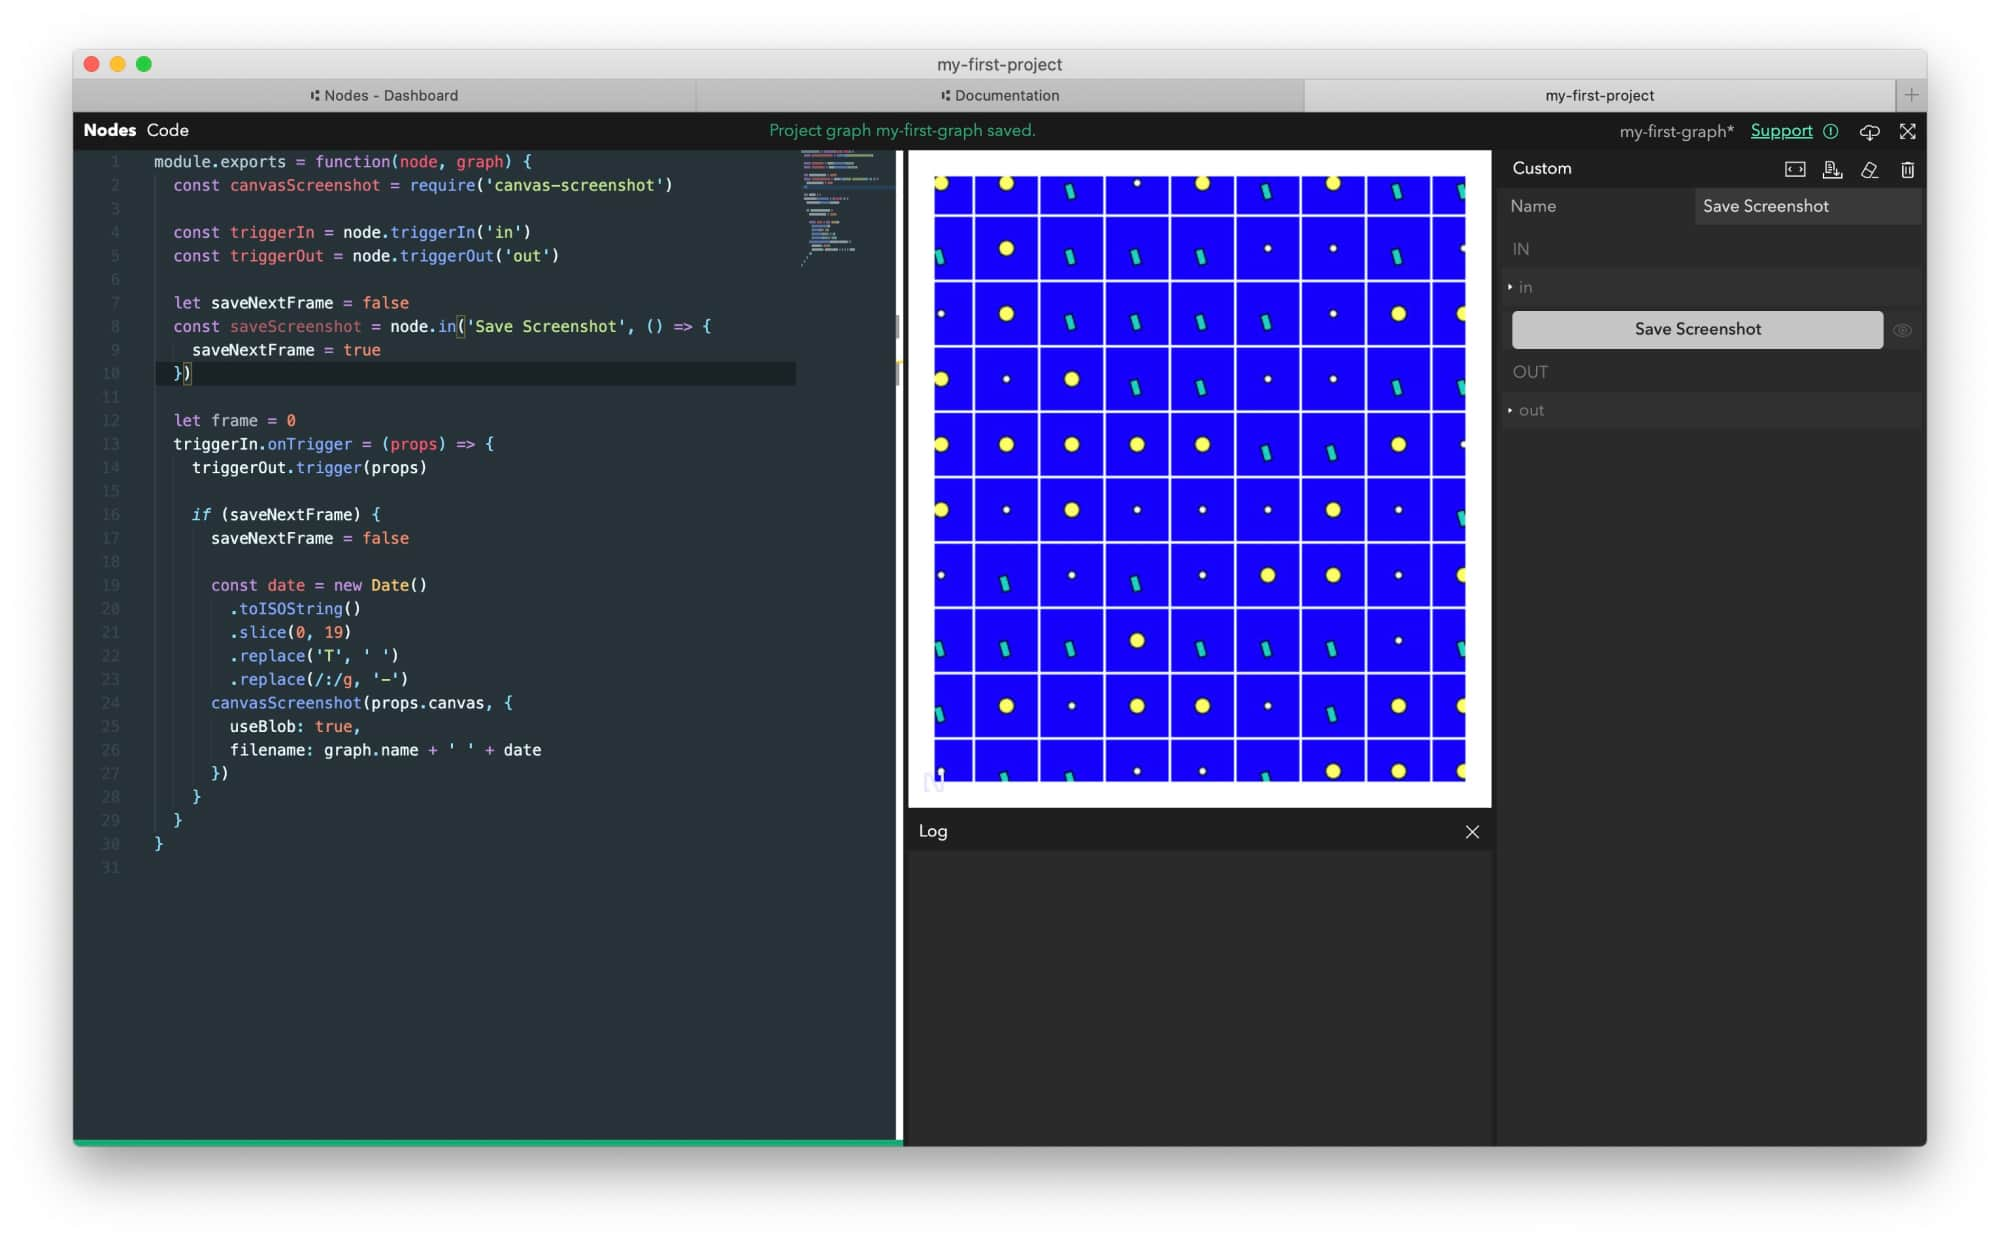
- Create a
Save Screenshotnode with the following code:
module.exports = function (node, graph) {
const { default: canvasScreenshot } = require("canvas-screenshot");
const triggerIn = node.triggerIn("in");
const triggerOut = node.triggerOut("out");
let saveNextFrame = false;
// having a function as second parameter to a port creates a butto in the inspector
const saveScreenshot = node.in("Save Screenshot", () => {
saveNextFrame = true;
});
let frame = 0;
triggerIn.onTrigger = (props) => {
triggerOut.trigger(props);
if (saveNextFrame) {
saveNextFrame = false;
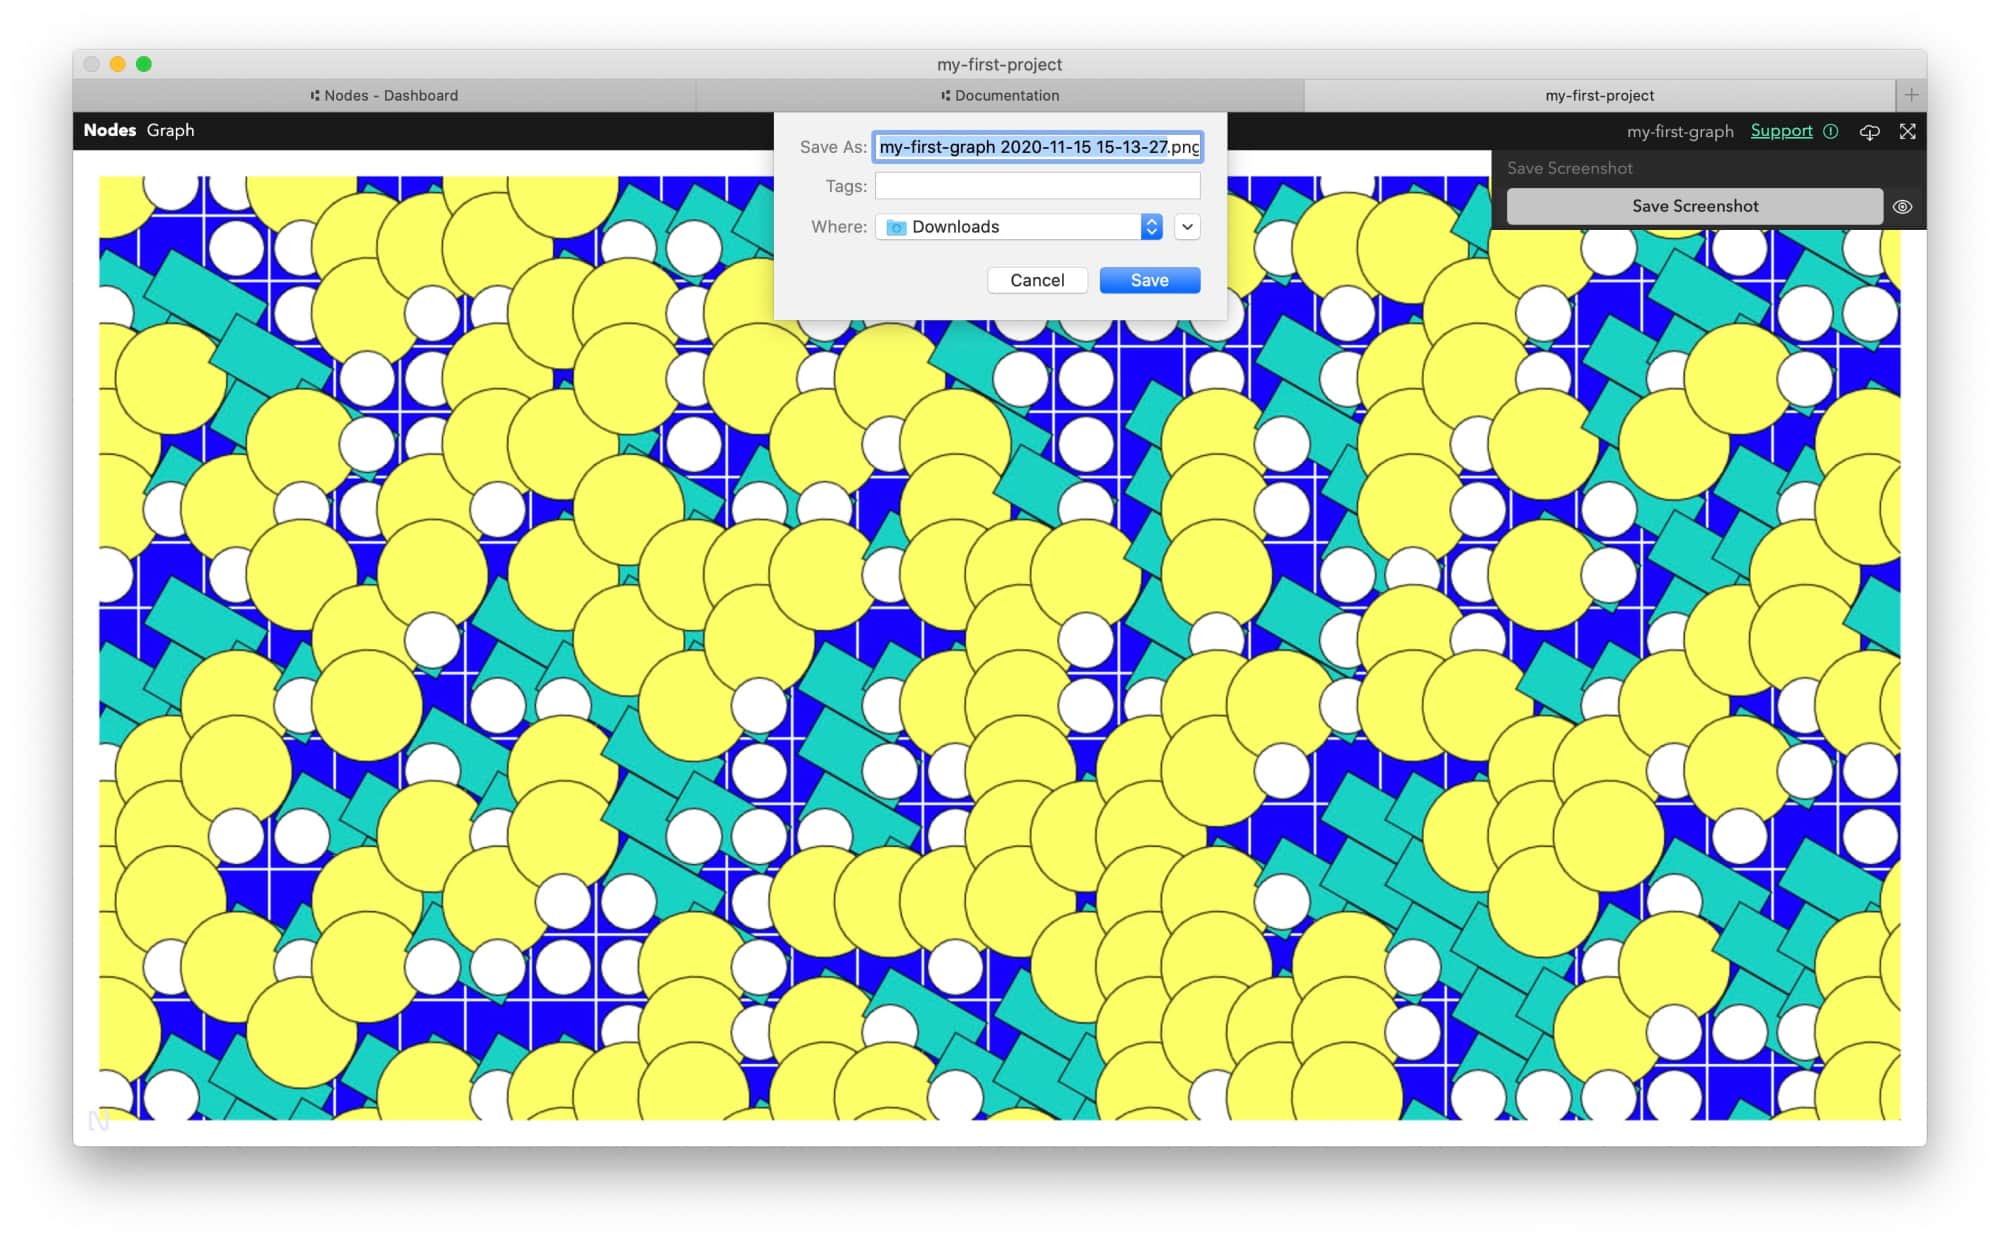
// create `graph-name YYYY-MM-DD hh:mm:ss.png` file name
const date = new Date()
.toISOString()
.slice(0, 19)
.replace("T", " ")
.replace(/:/g, "-");
// create screenshot and trigger file download
canvasScreenshot(props.canvas, {
useBlob: true,
filename: graph.name + " " + date,
});
}
};
};
Put the Save Screenshot node in between the Canvas and Draw Grid nodes:
- connect the trigger
outof theCanvasnode to the triggerinofSave Screenshotnode - connect the trigger
outofSave Screenshotnode to the triggerinofDraw Gridnode
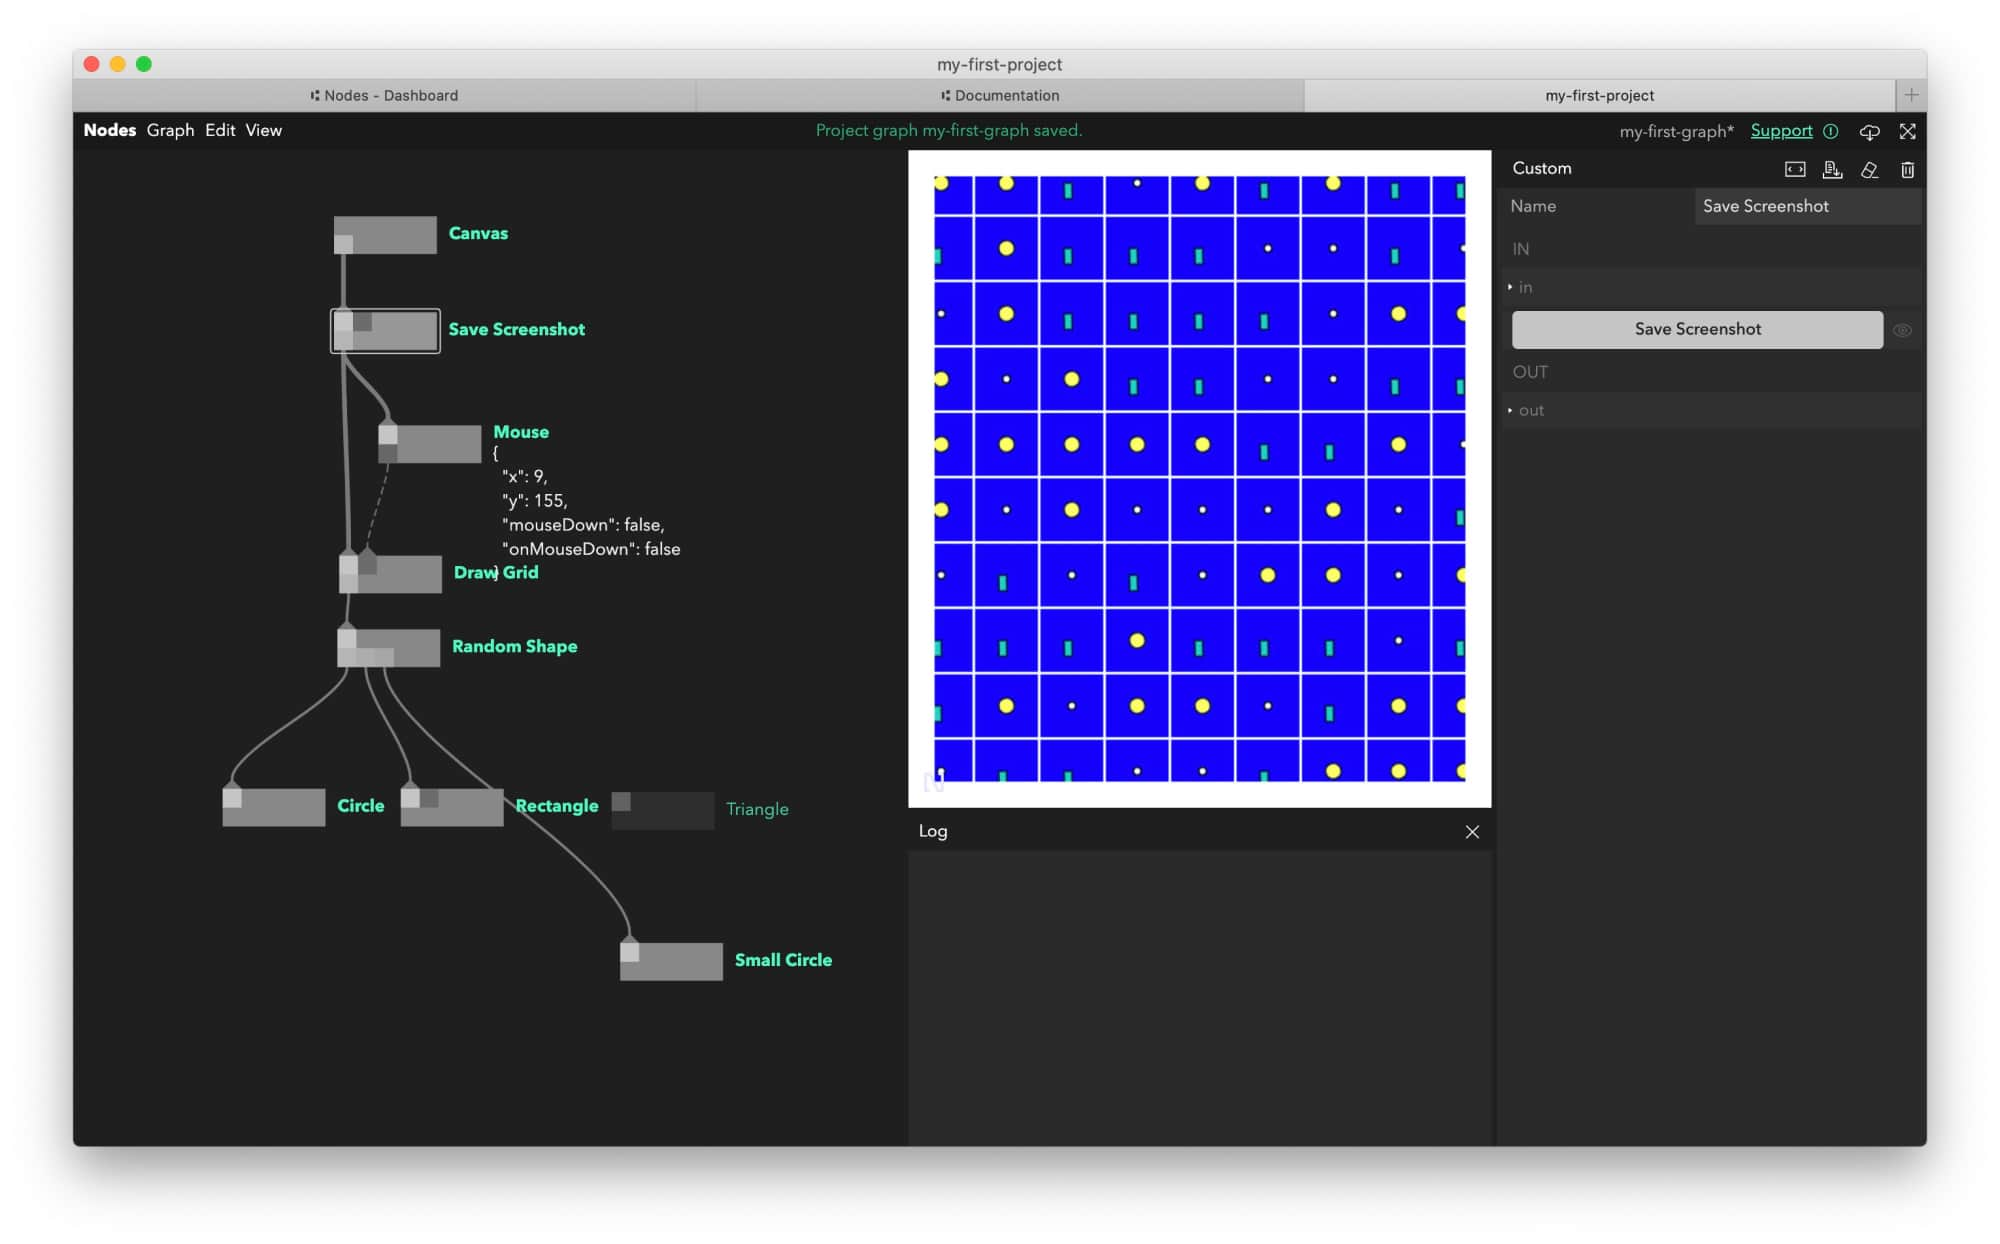
After selecting the Save Screenshot, click on the little eye icon next to the Save Screenshot button in the Inspector.
Go fullscreen by pressing the icon in the top right of the window, or by pressing the f key.
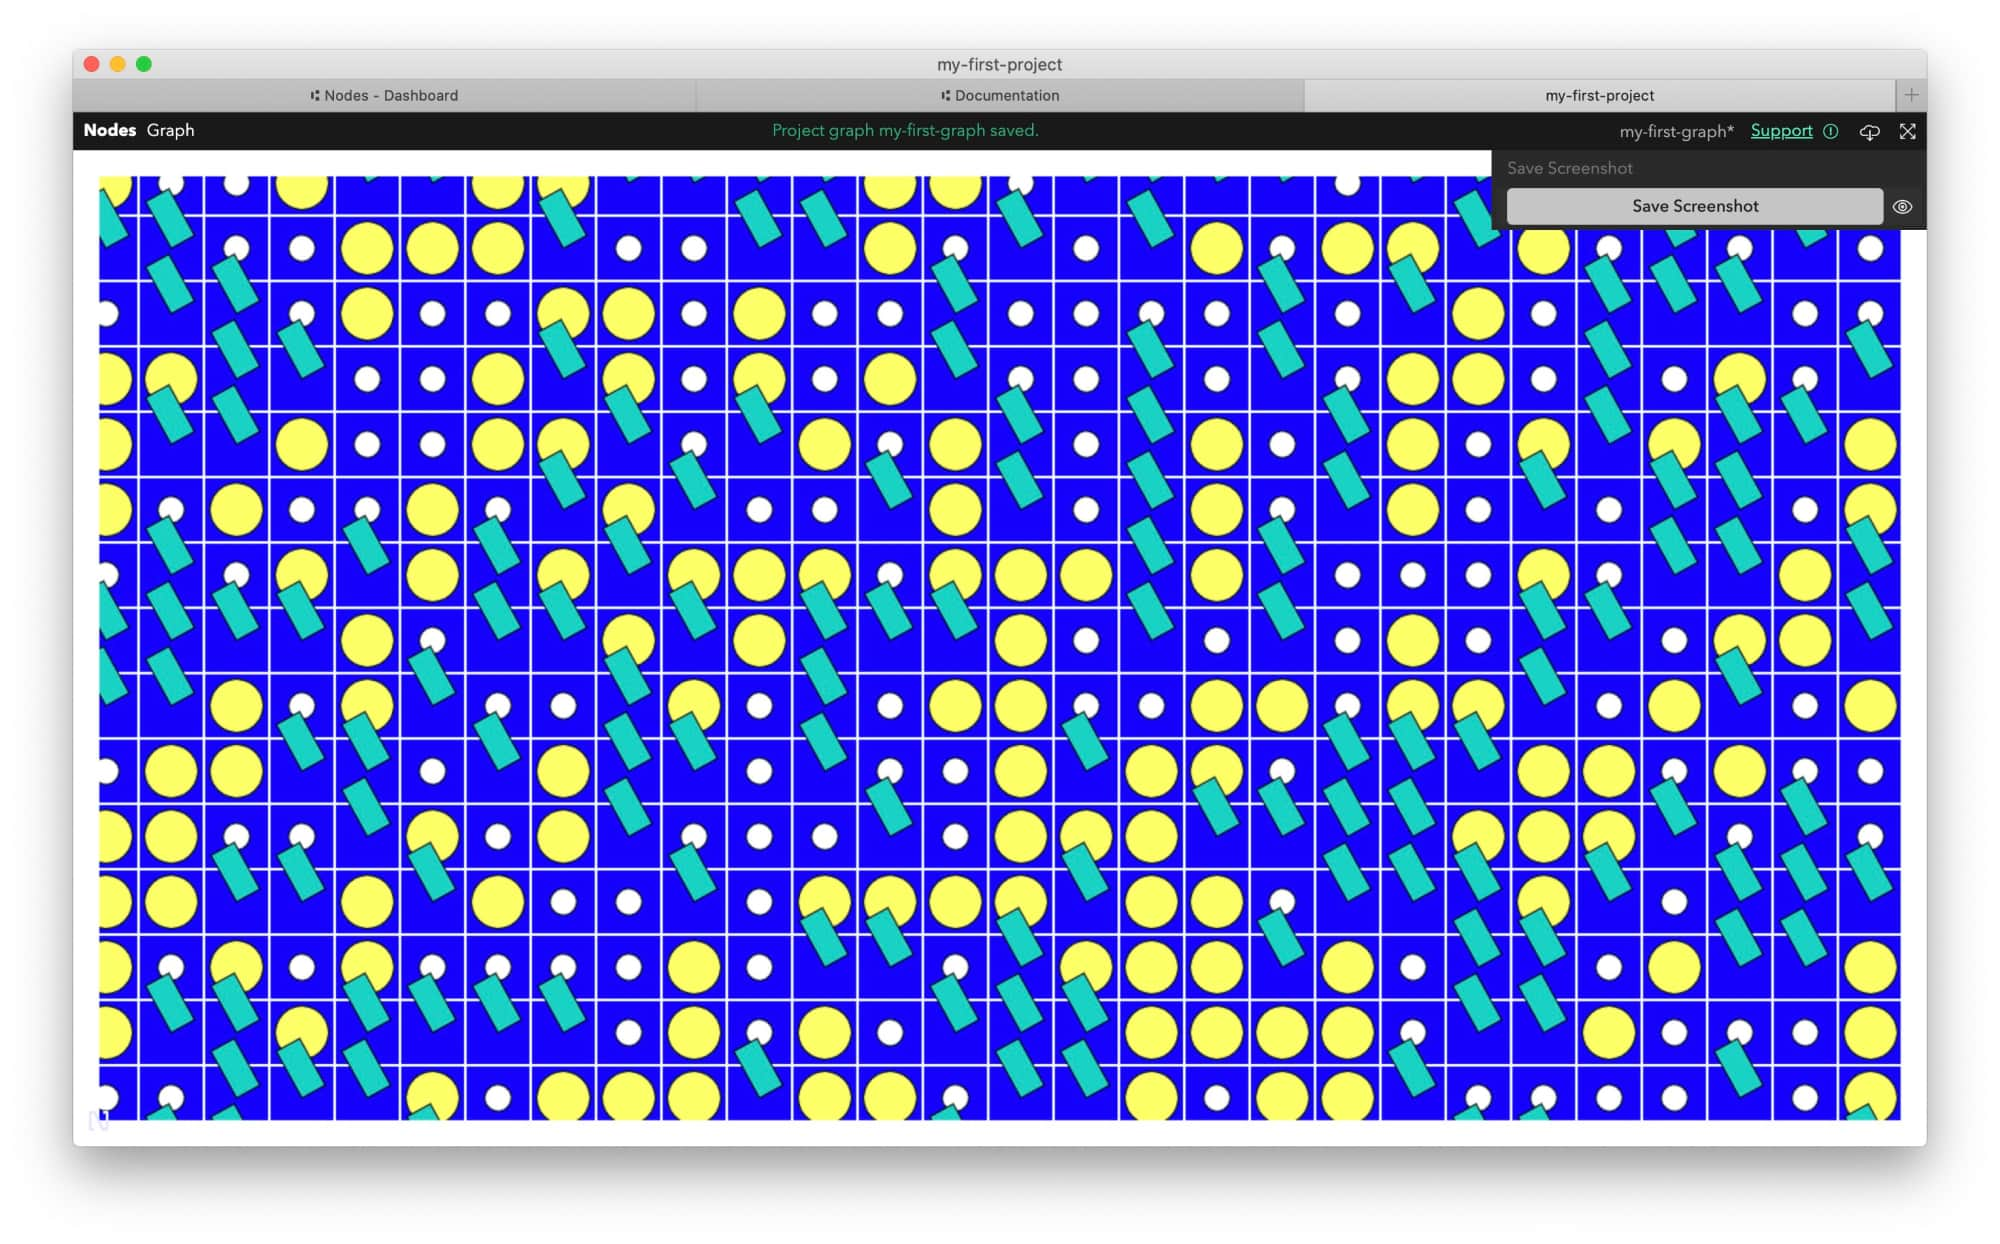
You’ll notice the Save Screenshot is present: click on it to download your creation.
Summing up
We have learned how to:
- create new nodes
- customize them with parameters
- install additional packages
See Also
Here are some generative art resources to check out:
Tutorials
Books
Courses
Next steps
If something is missing or if you found some part confusing, please file an issue with your suggestions for improvement, tweet at the @nodes_io account or simply drop up a line at hello@nodes.io.
We now recommend you check out the other examples in the Playground or run them locally in your Nodes app Dashboard. Find the rest of the documentation links below: